Category: Sports
The Threshold of Human Perception
by Ken Arneson
2020-07-26 23:30

One of the beautiful things about baseball is the randomness of it. Differences in skill don’t become obvious after one game, or ten, or maybe even a hundred. Anyone can have a good game, or a bad one. The significance of an individual game isn’t quite visible to human perception.

Looking into the pitching matchups going into this A’s-Angels series, I would have figured the A’s to beat Dylan Bundy, but lose to Shohei Ohtani. Of course, baseball is baseball, and precisely the opposite happened. Bundy was dominant, while Ohtani couldn’t retire a single batter.

Ohtani was pitching for the first time since returning from Tommy John surgery. It was obvious he wasn’t anywhere near his old form. His fastball was about 5mph slower than before the surgery. Worse, he couldn’t locate the pitch where he wanted to, either. He gave up some hits, and some walks, and before you know it, Ohtani had thrown 30 pitches, retired nobody, and given up five runs.

The Angels mounted a comeback, thanks to the greatest player in the game, Mike Trout, who destroyed a 3-0 fastball from Mike Fiers to cut the lead to 5-3. And speaking of unpredictability, this was the first 3-0 pitch that Trout had swung at since 2016. It was a terrible pitch by Fiers, but he probably wasn’t expecting Trout to swing at all, given his history. If that data on Trout’s tendencies didn’t exist, Fiers probably wouldn’t have grooved that pitch.

Mike Trout is the greatest player of this generation. He might end up being the greatest player of all time. But like baseball itself, his greatness is subtle. You may not notice it if you just watch a game or two. Trout is not flashy, at all. He doesn’t have a body chiseled like a statue by Michaelangelo. His swing is not an aesthetically pleasing work of art. He’s just solidly, unrelentingly, consistently difficult to pitch to. When you add up his numbers, day after day, year after year, he always comes out on top.

If the beauty and mystery of baseball lies in its ability to operate just below the threshold of human perception, the Moneyball movement was all about removing that mystery. The numbers tell a story that human eyes can’t see. They allow us perceive those inperceivable elements of the game, help us transcend our human limitations, and triumph.

It takes a leap of faith to believe in something that you can’t really see. At first, the old guard resisted the new information, railing against the “nerds” who wanted to “ruin” their game. In the end, though, Moneyball became the standard practice. Just because you can’t see something, doesn’t mean it isn’t real.

I went out on a bike ride today. For some reason, someone had found it necessary to write the following in chalk on the bike path:

coronavirus isn't real

It’s easy to draw the parallel here, that much of what is going on in America right now is formed from a similar resistance by human beings to believe in the existence of things that operate just below the threshold of perception, that only show up in the statistics.

If you’re not an African-American, you likely haven’t been on the receiving end of repeated and persistent distrust, haven’t been followed by security guards in a store, been pulled over while driving a car without cause, been beaten for no reason at all. They aren’t personal experiences to you. They’re just statistics. It takes a leap of faith to believe them.

If you don’t personally know anyone who has been sick, the dangers of COVID-19 aren’t visible, either. They’re just numbers in a sea of numbers. 4,000,000 infected and 150,000 dead, but you don’t know any of them. 10x deadlier than the flu, and 2.5x more contagious, but how do you find horror in a mere handful of digits. A mask can cut your risk of catching the disease by 60%, and the risk of spreading it by 90%, but if you’ve experienced zero, 90% of zero is still zero. Can you believe these mysterious numbers enough to take social distancing seriously, enough to wear a mask in public?

Human beings often have a hard time believing things until those things become visible with their own eyes. They think “corona virus is not real”, until someone they personally know gets sick with the disease. They think racial discrimination is an exaggeration, until they see undeniable evidence of the cruelty of racial violence, such as George Floyd being choked to death for 8 minutes and 46 seconds.

We baseball fans like to think that baseball, via Moneyball, now has the kind of culture that believes what the numbers tell us, without always being able to grasp with our own eyes what the numbers are telling us.

And yet here we are — here I am — watching baseball through a pandemic and racial unrest, thinking and hoping that it will work out all right, refusing to stare directly at the statistical unlikelihood that the endeavor will succeed, plowing forward instead with the good old status quo until inevitably presented with the unwanted, undeniable evidence to the contrary which falls within the threshold of human perception.

Amateurs
by Ken Arneson
2020-07-25 23:30

In our last exciting episode, we talked about how Matt Olson had envisioned a situation in his head. He imagined what he would do in that situation. The situation he envisioned happened. He did exactly what he imagined he would do. Everyone lived happily ever after.

It doesn’t always work out that way.

Before deciding to revive this blog to chronicle the unusual 2020 baseball season, my first idea was to dip my toes into podcasting. I had an idea that might make for an interesting format for a podcast. So in connection with the first A’s exhibition game on Tuesday against the Giants, I gave the format a rehearsal.

There’s a difference between envisioning something when you’re an expert, and envisioning something when you’re an amateur. An expert knows all the nuts and bolts from Point A to Point Z. When they envision a solution to something, their solution includes and accounts for all those nuts and bolts. When you envision a solution as an amateur, not only do you not account for all those nuts and bolts, you’re not even aware that those nuts and bolts exist.

All of which is to say, until Wednesday, I didn’t even know how little I knew about the process of editing a podcast.

Later that Wednesday, Baseball Prospectus held a roundtable discussion on Zoom about the upcoming season. It was an interesting discussion, but after spending half the day beforehand listening to and editing my own voice, I couldn’t help but feel like I was listening to a podcast being played at 1.5x speed. Everybody was talking so fast!

Of course, they were probably all just speaking at a normal speed for human beings. I’m the weird one whose everyday speech sounds like you’re listening to a podcast at 0.75x speed.

It was then I realized that even if the podcast idea was good in general, editing a podcast with me as the host would take more effort and time than I want to put into this. Information received, lesson learned, plans adjusted, blog launched.

When it comes to a pandemic, all of us are amateurs to some extent. None of us have done this before. Epidemiologists have thought about it the most, of course, but there are specifics about this particular virus that even they couldn’t have planned for. There’s going to be some learning on the fly, some adapting to do. The question is, how well and quickly do we learn and adapt to the new information that comes in?

The A’s lost to the Angels today, 4-1. And part of the reason the A’s lost is because they had never started a season with only three weeks of training leading up to it.

Sean Manaea started the game for the A’s, and he was perfect through the first three innings. His fastball was sitting at 89-90mph, and he was locating his pitches well.

Manaea gave up a solo homer to Justin Upton in the fourth inning. Then everything fell apart in the fifth. His fastball suddenly dropped a few mph in velocity, so that it was now 86-87mph. Manaea quickly went from unhittable to very hittable, and the next thing you knew, the A’s trailed by four runs.

Frankie Montas seemed to fall apart very quickly after about four innings the game before, as well. So perhaps there’s a lesson for Bob Melvin to learn and adapt to: in a season like this, he needs to have a quicker hook for his starting pitchers at the first sign of fatigue.

Meanwhile, Jesús Luzardo came on in relief and pitched three superlative innings. He looked ready for the rotation as much as anybody. Provided, of course, that Melvin is ready with the quick fatigue hook.

In a normal baseball season, in a normal year, an A’s loss would leave me feeling a little bit grumpy for the rest of the day.

To be honest, that same feeling crept into my head today. But at the same time, the pandemic is never very far from my consciousness. Being grumpy about my favorite team losing a ballgame was always a bit self-indulgent in any era. But today, recognizing in myself such a moment of grumpiness, quickly turned into a moment of guilt.

This season, being grumpy about the results of a baseball game is not just self-indulgent, but immoral. You have to have some perspective about all this. If that’s how I’m going to react to a baseball game, what the hell am I even doing? Why am I doing this? Why is anybody doing this?

I don’t know. I don’t even know what I don’t know. I’m just an ignorant amateur, among many ignorant amateurs, making up stuff on the fly, seeing what happens, hoping it works.

Hello, Is This Thing On?
by Ken Arneson
2020-07-24 23:30

When I wrote the Catfish Stew blog on the Baseball Toaster network from 2005-2009, it was at the peak of both blogging and of Moneyball. It seemed like every serious baseball analyst out there, A’s fan or not, would dissect anything and everything the A’s did from a statistical point of view.

I wanted Catfish Stew, and Baseball Toaster, to be different. The Toaster was about analyzing baseball, yes, but it was also about placing baseball in a human context, about how what was happening on the field connected to our lives, and to the greater world around us. It was about the emotions we feel as baseball fans as we watch the seasons unfold.

So for Catfish Stew specifically, I wanted to be the un-Moneyball A’s blog. That’s not to say the aim was to oppose Moneyball. Instead, it was to understand it, and the effects it had not just on the results on the field, but in the emotional lives of its fans. My goal was to chronicle what it felt like to be an A’s fan.

I stopped blogging about the A’s for many reasons, but among them was that I felt like I had said everything I wanted to say. One season became another became another. One emotion became another became another. I started to repeat myself.

There’s little about the year 2020, however, that is repetitive. And anything that isn’t is remarkable because this year, normal has become unusual.

Therefore, this season, there might be something new to say. So let’s plug in this toaster, and see if there’s anything worth cooking.

For the Oakland A’s, the 2020 regular season began on Friday, July 24, at home against the Los Angeles Angels.

***breaks fourth wall*** When I typed that last sentence, I just stared at it for like five minutes. I got angry just looking at it. I got angry at myself for typing it.

It’s a sentence that is both factual, and completely devoid of any context whatsoever. It’s a sentence that says absolutely nothing about the feelings a normal human being ought to have in this year like no other. It’s a sentence that captures nothing of the anger and sadness and outrage and despair that I feel about what is happening in the world around us. It a sentence that doesn’t even capture the bizarreness of a baseball game being played in a stadium completely empty of fans.

This isn’t a regular season. This is an abomination of a season, in an abomination of a year.

There are so many things more important than baseball right now: the pandemic, the Black Lives Matter movement, the creeping and expanding American fascism, continuing climate change, and the upcoming election.

MLB tried to acknowledge that context in the pre-game ceremony before the game. They had a moment of silence for people that had died. They took a knee to acknowledge Black Lives Matter. Some players on the Angels stayed on a knee during the national anthem. No A’s players did, although two, Khris Davis and Tony Kemp, raised their fists.

I’m glad they acknowledged the context. It would have been wrong if they didn’t. But acknowledgement is not a resolution.

I don’t know if they should be playing baseball right now. But I do know it still feels uncomfortable. I feel uncomfortable about enjoying the game. I feel guilty about wanting to write about it.

But the paradox of this pandemic is that while the scale of it is massive and affects everyone, most of use can contribute the most by staying home and doing nothing. It’s hard to do nothing.

Maybe baseball players feel like they can help, just a little, by doing what they do best, by giving people something to do at home to pass the time. And similarly, maybe I feel like I can help, just a little, by doing what I (used to be) good at, too.

Or maybe that’s just grasping at straws. None of us has any experience at this. We’re all just winging it as we go along.

The game started with Frankie Montas on the mound for the A’s. He seemed a bit amped up. His fastball was moving like crazy, and he was having trouble keeping the ball in the strike zone. He walked some guys. So Montas did what you’re supposed to do when that happens, he tried to throw some breaking pitches instead.

Three times that inning, Frankie Montas threw a slider that the strike zone superimposed on the screen indicated was a strike. All three times, the umpire called it a ball. The third time this happened, I yelled at my screen, “OH COME ON!”

I’m watching baseball in the middle of a global pandemic, and barely five minutes into it, I’m angry and yelling at the umpire.

Such a normal thing, in normal times. It’s not normal times. There are so many other things I should be upset about before being upset about an umpire who can’t recognize a slider properly.

But I’m a human being. And lately, there’s been a lot of evidence coming to light that human beings are idiots.

In the ninth inning, Liam Hendriks was on to try to save a 3-2 lead for the A’s. He threw a slider to Jason Castro that many other umpires would have called strike three. This umpire did not. Two pitches later, Castro hit a fastball for a home run that tied the game. The game went to extra innings.

Because of the shortened nature of the 2020 baseball season, and the limited number of players available to play during the pandemic, MLB decided to minimize the number of long, extra-inning games by starting each extra inning with a runner on second. This was the first MLB game ever played under these new rules.

So the top of the 10th began with Shohei Ohtani, who had made the last out of the ninth inning for the Angels, placed on second base. Jared Walsh led off the inning by hitting a sharp grounder to A’s first baseman Matt Olson, who scooped the ball and quickly whirled and threw the ball to Matt Chapman at third base. In most game situations, a first baseman would take a grounder like that and get the safe out at first base. Olson decided otherwise, and Ohtani was caught in a rundown, and tagged out. This effectively killed the gifted rally for the Angels, and they did not score.

In the bottom of the inning, Marcus Semien was placed on second to begin the inning. Ramon Laureano was hit by a pitch, and after Chapman struck out, Davis drew a walk to load the bases. This brought up Olson with the bases loaded and one out.

Olson bats left-handed, so Angels manager Joe Maddon brought in a lefty pitcher named Hoby Milner to face Olson. Olson is an extreme fly ball hitter, so much so that some teams have deployed four outfielders against him instead of the usual three. But that strategy would be useless in this case. A fly ball by Olson here would probably result in a sacrifice fly that would win the game. The Angels needed a ground ball double play, and so Madden actually did the opposite, moving an outfielder to the infield, resulting in five infielders and only two outfielders.

Madden’s strategy did not work. Olson did not hit a ground ball. He did what he does best, and hit Milner’s first pitch in the air, deep into right field. So deep, in fact, that it went over the fence for a walkoff grand slam home run. The A’s had won the game, 7-3.

Ahhhhhhhhhhhh. That felt sweet.

After the game, Olson was interviewed about both the defensive play he made to throw out Ohtani, and about the game winning grand slam.

Regarding the Ohtani play, Olson said that he and Matt Chapman had been discussing that specific play, a runner on second with no outs in a close game, for a couple years now. They discussed it again because of the new rules. When the ball was hit directly to him, he knew exactly what he wanted to do.

On the grand slam, Olson said that he didn’t know much about Milner, so he had watched a lot of video of him, and learned that he liked to get ahead in the count by throwing sliders. He decided to go into the at-bat sitting on a slider on the first pitch, and that was exactly what he got. The rest was history.

Imagine this: a completely new and novel situations arises. Then imagine that there’s a person in a position of responsibility who had studied and thought through in advance exactly what he should do in such a new and novel situation. And imagine that this person then simply executes on his plan, and that success ensues.

What a concept. In a world full of unstable idiots who just cockily wing it in the moment, a person who is thoughtful and prepared can end up looking like a genius.

For the Oakland A’s, the 2020 regular season began on Friday, July 24, at home against the Los Angeles Angels. The A’s won the game, 7-3, in 10 innings.

Perhaps that fact is distastefully decadent and frivolous. Perhaps we should feel ashamed to have enjoyed it.

Or perhaps, a man like Matt Olson is exactly what the world needs right now.

Catfish Stew Reanimation
by Ken Arneson
2020-07-23 16:28

Since this MLB season is going to be so short, I decided I would take the time to blog about the A’s again. 60 games is a much smaller commitment than 162 games.

I don’t know if there’s anyone following this blog that doesn’t already follow me on Twitter, but if so, here is the link to the 2020 Special Edition Catfish Stew blog.

On National Anthem Protests
by Ken Arneson
2020-06-03 21:39

Much of the rhetoric about protesting during the American national anthem assumes that the song is a statement about our country, a declaration of allegiance, an honoring of its history. That’s a natural assumption to make, because for nearly every national anthem, that assumption is true.

There are over 200 countries on Earth, each with its own national anthem. I looked up all of them, with their translations into English.

Every single one of these anthems, save one, is a series of statements about its country: I love my country, here are some nice things about my country, I would die for my country, here are the ideals of our country, I honor those before me who fought for my country, God bless our country, etc.

A small handful of these anthems (e.g. Czechia, Denmark, Iraq, Italy) don’t just make statements, but also ask a question within the song. But those questions are just a minor part of the song. The bulk of those songs are still statements.

There’s only one anthem that is not primarily a series of statements about its country. There’s only one national anthem that is structured in the form of a question: the national anthem of the United States of America.

When you stand up before a sporting event and sing The Star-Spangled Banner, you aren’t making a declaration. You’re asking this:

…does that star-spangled banner yet wave
o’er the land of the free
and the home of the brave?

In other words: Is our country a free country? And do we have the courage it takes to be free?

If there is such a thing as American Exceptionalism, something that sets us apart from all those other nations with all those other anthems, it is in those questions, in the repeated asking of them, in the dissatisfaction with the status quo, in the demand for improvement, in the insistence of staring our problems square in the eye and being brave enough to take them on.

This is where I take issue with people like Drew Brees, who claim that the national anthem is not the time for protest. For every other national anthem on earth, that’s probably true. But for ours, for the singing of the Star-Spangled Banner, resisting such rote declarations is exactly what the song itself is asking you to do.

If you want freedom, if you want to be a free country, you have to constantly ask yourself if you are free. And you also have to have the courage to answer that question honestly. You have to be brave enough to say no, we are not free, when the easy thing to do would be just to say yes and move along and not make any trouble.

Now to be accurate, the Star-Spangled Banner is not entirely a question. The longer, original poem has verses that are statements. And there is one section of the Star-Spangled Banner as sung that is not in the form of a question, either:

And the rocket’s red glare, the bombs bursting in air,
Gave proof thru the night that our flag was still there.

But even that one statement in a sea of questions is a statement in favor of questioning our freedom.

Freedom is difficult. If freedom was easy, every single one of those older countries would have come up with it first. Freedom is hard because it requires us to trust other people, many of whom may do things with that freedom that we don’t like. The temptation is always there to put a stop to those things we don’t like, to prevent the things we fear. The desire to control other people is everpresent. Yes, sometimes those things we fear are truly dangerous, and ought to be stopped. But it’s not the act of stopping or not stopping those dangerous things that kills freedom. It’s the act of preventing the fight. And so the only true proof that freedom is alive is if the red glare of protest is shining against the forces of control.

Now this is not to say that every protester is right. If you have a protest and a counterprotest, one of them must be wrong. The content of each protest must be judged on its own merits. But the timing? The timing is never better than when we are engaged in the ritual questioning of our own freedom, in the singing of The Star-Spangled Banner.

Slow Motion Disasters
by Ken Arneson
2020-05-09 9:53

One of my most widely read essays was written in 2012, called MLB’s Customer Alignment Problem. In that article, I explained how increasingly, MLB’s revenues and franchise values were strongly tied to cable and satellite network fees. That was a problem because:

  • cord cutting was shrinking the cable and satellite TV network industry
  • live sports like MLB was the only thing propping up the cable and satellite TV network industry
  • this indirect income stream disconnected the industry from direct feedback from their real customers, the fans
  • without direct feedback, MLB would likely be slow to react to needed change, both positively and negatively

It seemed like a Ponzi scheme to me, or a house of cards, or a Jenga tower, pick your favorite metaphor. Every cord cutter takes a block out of that Jenga tower with them when they go. You never know when the tower is going to fall over, you just know that eventually it will.

That was eight years ago. Cord cutting has continued apace. It’s not so much that old fans cut the cord. It’s that they die, and aren’t replaced by young fans. Young people simply don’t buy cable TV. The average age of a baseball fan in 2007 was 53. In 2017, it was 57.

So now you’re starting to see articles asking things like Are Millenials Killing Baseball? The answer, of course, is NO, THEY’RE NOT. MLB simply isn’t reaching them, because MLB’s incentive structure stops them from meeting Millenials where they are.

Of course, last we checked, baseball isn’t dead. Last year, MLB’s revenues were fine, ratings were fine, attendance was fine, everyone was making money. And over the last eight years, most of those regional TV networks who had such a wobbly mutual dependence with MLB have gotten themselves folded into much larger corporate conglomerates.

But what happens if we pull some really big blocks out of that Jenga stack?

In the time of the pandemic, the trend has become clear — cord-cutting is happening faster. While widespread stay-at-home orders have catapulted the growth of streaming, the coronavirus pandemic has accelerated a parallel trend: a sharp decline in subscriptions to the cable bundle. Pay-TV providers are coming off their worst quarter ever, shedding more than 2 million subscribers in the first three months of 2020, or around 3% of the customer base. That’s equal to roughly 40% of the total losses pay-TV providers suffered all of last year.

Ouch.

None of us know the inner financial workings of any MLB teams. Nor do we know any of the inner workings of any of the Pay-TV providers. It’s easy to sit on the sidelines and say as many people do on Twitter, “You’re billionaires, suck it up.” But I think that attitude is based on an outdated idea of some sole Scrooge McDuck owner who sits on a pile of gold coins in his vault somewhere, where the price of a ballteam is a pittance for them. But nowadays, most MLB teams are so expensive that there are very few Scrooge McDucks who can own a team by themselves and pay for it with cash. Most teams are owned by an assembled group of people who pay for it using loans secured with collateral. These ownership groups really don’t want their collateral touched. That’s especially true if it’s some large publicly owned conglomerate on the stock market. Covering losses is not anywhere near as simple as asking McDuck to pull another coin out of his vault. Instead, getting any sort of decision made is a big giant mess of regulations and internal politics.

All of which is to say, this pandemic is creating a lot of pressure on MLB teams from a lot of different directions. And the first sign of that pressure is when the weakest link in the MLB value chain starts to break. And that weakest link is…drumroll please…the minor leagues.

Minor league teams and minor league players have a strongly dependent relationship with MLB, with absolutely no leverage at all. They are a source of cost for MLB, with very little direct revenue coming back to MLB. So when MLB revenues start to get squeezed, where do you think they’re going to look first to cut costs? The place with the least resistance to those cost cuts and the least effect on revenues, of course.

So now all of a sudden, the minor leagues are going to be reduced from 160 teams to 120. The draft is going to be reduced from 40 rounds to 5. What could the minor leagues and the new potential minor leaguers do about it? Nothing. They’re the weakest links in the chain. It was inevitable that they would be the first to crack.

You wonder, then, if this pandemic drags on for another year or two, what are the next-weakest links in the chain? Who will be the next group of people that MLB’s structural issues will collapse on top of?

* * *

Nobody could foresee this particular pandemic coming at this particular time. But the fact that some negative externality could lead to financial problems within MLB: that was entirely foreseeable. It’s been built into MLB’s business model for over a decade now.

One thing this pandemic has made clear: we are terrible as a society, and perhaps as a species, at dealing with slow-motion disasters. There are so many problems we can see coming from a long ways away, but we don’t do much about them because they’re a long ways away.

Until they’re not, and then it’s too late.

There are many slow-motion disasters that we aren’t doing anything about. Pandemic preparedness, in hindsight, was an obvious one. Climate change is another, of course.

Interestingly, the Republican Party has the *exact* same slow-motion disaster happening to them as MLB. Their whole business model, like MLB’s, depends on cable TV networks keeping old white people attached to what they’re selling. Their problem, like MLB’s, is that their demographic keeps getting older and dying off, and the young people don’t have Cable TV, don’t watch their schtick, and so they don’t buy into what they’re selling fast enough to replace the old ones who die off. It’s a slow demographic train wreck happening for them, and you can see it coming. The Republicans *know* it’s coming, that’s why they keep trying to hold that demographic train wreck at bay on the backs of America’s politically weakest links by restricting minority voting access and cutting immigration. That may work for awhile, but at some point in the next decade or so, demographic shifts will cause some big states like Georgia and/or Texas and/or Florida to flip, and then it’s game over. Their only advantage over MLB is that they only have one incompetent competitor to worry about, while MLB not only has to fend off their rival sports to stay afloat, it also has to fight new innovators like Netflix and video games and social media for attention.

The pandemic has added urgency to Republican dilemma, too, because if the economy doesn’t recover by November, that demographic train wreck might happen this year instead of 10-20 years down the line. So you’re seeing Republicans putting a lot of pressure on decision makers to “open up the economy” as soon as possible. But that, in itself, is another slow-motion disaster about to happen. The shelter-in-place orders have lowered the R0 of the disease from 2.5 to about 1.0 or even below 1.0, but as soon as it opens up again, the R0 will jump back up again. It probably won’t jump all the way back up to 2.5, because many people will be cautious and avoid high-risk activities, but it will probably jump back up to something like 1.5. And that means the death rate will look like it’s holding steady for a month or three, but then the exponential growth will start to take effect, and we’ll get a surge of illness and deaths in August or September or October that will be as bad or worse than the first one. But this time, the fall guys won’t be the politically weakest links as much as the physically weakest ones, who just happen to be the kind of old, sedentary people who spend a lot of time watching baseball and Fox News.

And then what?

Moneyballing a Ballpark
by Ken Arneson
2019-11-25 14:00

The human brain is amazing. It can take a very limited amount of information, and turn around and give you an instant decision based on that limited information. Computers, on the other hand, are really bad at that. With a computer, all the variables must be filled in, or the program won’t run.

The Oakland A’s are trying to build a new baseball park. There are questions in the Oaklandsphere whether they should build it at the Coliseum or at Howard Terminal. Much of the debate around those questions takes place in a foggy, muddled soup of barely identifiable information about (a) how much the ballpark would cost, and (b) how much money it would make if they built it.

But hey, we’re human beings! Our lives aren’t math problems in a textbook. We go through our lives dealing with incomplete information almost all of the time, no big deal. Just because we have almost no idea at all about any of the money involved with this doesn’t mean we can’t end up deciding with conviction that we prefer one site or the other.

So we end up ignoring the information we don’t have and focus on information we do have. Or, we make wild guesses at the information we don’t have, and go with that. Or, most likely of all, because we’re human beings and building a ballpark is really not our job, we’re not going to spend any energy to think it through at all, so we’ll just stick with our gut reactions to the idea, and that’s good enough.

And therefore: messy, muddled ballpark debates.

Not really any different from any other debate in human affairs. It’s all cool.

EXCEPT.

Except: this is the Oakland Athletics we’re talking about.

The Oakland A’s. Team Moneyball. The organization out of all human organizations in all human societies in all of human history that is most famous for turning life into a math problem.

Back when statistical analysis in baseball started to become a thing, a lot of old school types tried to argue against it. And they kept getting their asses handed to them, because they didn’t understand sabermetrics. Their arguments (“Batting average and RBIs are good enough! Watch a game, not the computer!”) were utter crap. This is a point I’ve made before, but the best arguments against sabermetrics are made by the people who actually understand sabermetrics, who know what its true flaws and blind spots are.

Sure, the math in ballpark building is different from the math in baseball games. But sabermetrics is not just about the math. It’s about how you think about the game.

Remember this conversation in Moneyball?

People who run ballclubs think in terms of buying players. Your goal shouldn’t be to buy players. Your goal should be to buy wins. And in order to buy wins, you need to buy runs.

What is the ballpark equivalent of that conversation?

What do most people think the goal of building a ballpark is? What should that goal really be?

Let’s try to be creative. We may not have any of the numbers, but we can figure out how we would approach them if we did. Let’s try to move past muddled conversations, and think about how the A’s might be thinking about this ballpark. What would Jonah Hill tell Brad Pitt if they were building a baseball ballpark instead of a baseball team?

Let’s try to understand why the A’s might be making the choices they’re making. Let’s Moneyball a ballpark.

Investing and growth

Let’s begin by talking about investing. Why does anyone invest in any particular thing?

I think the most common (muddled) answer to that is, “to make a profit.” But that doesn’t answer the question. Because the question was, why does anyone invest in any particular thing? Lots of things make a profit. You could invest in a 1-year US Treasury bond today and make a profit of about 1.6% in that year. Or, you could invest in a 30-year US Treasury bond today and make a profit of about 2.3% a year over 30 years. Or–and here’s the rule of thumb to keep in your head–you could invest that money in a boring stock market fund and make a profit of (historically, on average) about 7%-10% a year. So why are you investing in that particular thing and not some other thing, like a Treasury bond or a stock market fund?

If we think of mere profitability as the goal–that as long as we don’t lose money, it’s fine–we don’t have a Moneyball mindset. We’re more likely to continue doing what we did before, because we didn’t lose money. This kind of thinking tends to lead people to prefer the Coliseum site, because hey, the Coliseum worked for 50 years, didn’t it? We can probably build a nice, cheap stadium on that site and make our money back in the end, so if it’s not broke, why fix it?

But if mere profitability is the end goal, the A’s ownership team probably shouldn’t invest in a ballpark at all. They should sell the team, and put the money in the stock market and make their 7-10% a year.

But when you start to think that an investment in a ballpark needs to grow at a rate greater than 10% a year, well, now we have a much more complicated question with a much more unclear answer. We should be asking, “What rate of growth are we trying to achieve with our investment?”

Volatility of outcomes

OK, suppose we get the growth idea. But there’s another kind of muddled thinking that comes with that, and that’s to make a single estimate of growth, and make a choice based on that. Suppose we estimate that the Coliseum site will grow at 15% and Howard Terminal at 30%. We should choose Howard Terminal, right? Not so fast.

Those single numbers are just estimates. In reality, there’s a whole range of possible outcomes. I think most people would guess that the range of possible outcomes at the Coliseum is smaller than at Howard Terminal. Suppose (pulling numbers out of the air) the Coliseum could grow somewhere between +10% and +20%, while Howard Terminal could grow somewhere between -20% and +50%. Are we willing to risk a big loss for a chance at spectacular growth? Or do we want a safe bet with a smaller upside?

There’s no obvious answer to that question. I can understand preferring the choice with the lowest downside or the choice with the biggest upside, but insisting that one or the other is obvious and clear is, well, obviously and clearly wrong.

So we shouldn’t be asking, “Will this make a profit or not?” We should be asking, “What is the range and distribution of possible outcomes, and how comfortable are we with those possible outcomes? What are our minimum acceptable and target growth rates for our investment?”

Ways to grow

That brings us to our third source of muddlement. When we say “grow”, what do we actually mean by that? How do we actually grow a business?

The ballpark translation of that first Jonah Hill sentence is probably something like, “people think if you build a nice ballpark, you’ll sell more seats.” Which, like “buying players” is both true and at the same time muddled. It’s not a Moneyball way of thinking about it.

The Moneyball way to think about it this is to start breaking it down like Jonah Hill does. In sabermetrics, you want to buy wins. In order to buy wins, you need to buy runs. Where do runs come from? Lots of different places: batting, running, catching, throwing, pitching, all of which have their subcomponents, each of which has its different price in the marketplace. What’s the most cost-effective way to purchase those subcomponents to assemble the runs and wins you need?

The Moneyball ballpark question then becomes: what’s the most cost-effective way to assemble the subcomponents of a ballpark that we need, in order to achieve the growth that we want?

Big Things and Little Things

On the baseball field, there are many statistical subcomponents you can try to improve on. Some of them, however, will have a bigger impact than others.

There is a statistic called the “Beane Count“. It was invented by writer Rob Neyer shortly after Moneyball came out, and is named for A’s executive Billy Beane. It tracks two main statistics, on each side of the ball. Those are:

  • Walks
    • Taking walks
    • Not yielding walks
  • Home runs
    • Hitting home runs
    • Not yielding home runs

If you look at Beane Count for 2019, the top 6 teams in Beane Count in the American League were the six teams that made the playoffs. In the National League, five of the top 6 teams in Beane Count were playoff teams, and the one that wasn’t, the Milwaukee Brewers, was 7th. So the stat correlates with the primary goal of winning.

But there’s another key feature of the Beane Count that is significant for our purposes here: these particular stats kind of give you something for free. On both walks and home runs, the ball is not in play. You don’t have to participate in defense and baserunning. So you win the game, in a way, by avoiding having to play the game.

If we want to translate this piece of Moneyball to ballparks, there’s an analogous game we want to avoid playing if we can. Making a profit selling things is a difficult game to play, and achieving growth is even harder. In the normal game, you make a product for [$X]. The supply/demand curve directs you to sell it for [$Y], and so you end up with a margin of [$Y – $X].

Can you sell enough volume at that margin to reach your growth target? If that seems hard, is there a way you can get something for nothing out of $X or $Y to make it work?

Let’s make a business equivalent of the Beane Count. Call it the Kaval Count, after A’s President Dave Kaval. It tracks the things you can do that help you avoid playing the straightforward business game. Like the Beane Count, the Kaval Count has two main ideas, each split into two sub-ideas:

  • Covering costs externally
    • Subsidies
    • Arbitrage
  • Breaking the laws of supply and demand
    • Become a tech company
    • Become a monopoly

Subsidies

For decades, direct subsidies from local governments have been by far the #1 method for professional sports teams to reach their target growth numbers. Tell a city, “Help us pay for the cost of building our sports facility, or we will find another city who will.” In some parts of the country, cities have figured out that this is a bad deal. But as long as other parts of the country haven’t figured this out, it will continue being used.

So the Texas Rangers are constructing a new ballpark. How did they make the numbers work? They got someone else to pay for much of it. The Atlanta Braves also recently built a new ballpark. How did they make the numbers work? They got someone else to pay for much of it. The Oakland Raiders are building a new stadium in Las Vegas. Why? They got someone else to pay for it.

Oakland and Alameda County fell for this scheme in the 1990s, when they built Mount Davis to lure back the Raiders from Los Angeles. That plan did not work out at all, and the city and county are still deeply in debt from it. They won’t fall for that scheme again.

So direct subsidies for the A’s to build in Oakland are out of the question. However, there are certain infrastructural costs of construction that fall under the category of the normal activity of a city: building roads and transportation hubs and electrical grids and storm drains and sewers, etc. So while they may not get help subsidizing the building itself, it may still be politically feasible to get some of the surrounding infrastructure paid for. That alone is unlikely to get the A’s to their growth targets, but it may help some.


Arbitrage

Construction costs are not the only costs of building a ballpark. There is also the cost of the land we are building on top of.

In some cities, there is land which is zoned for one kind of use, but would be more valuable if it were zoned for some other kind of use. There is also the idea that the demand for land near a ballpark becomes more in demand simply because it’s near a ballpark.

In these cases, we’re not actually reducing the cost of building the ballpark. But we can arbitrage the difference between the value of the land without a ballpark, and the value of the land with a ballpark, and use that difference in value to finance the construction of the ballpark.

This is what the A’s are trying to do in Oakland.

Howard Terminal and the Coliseum are zoned somewhat differently, but most of the land for both sites is currently being used as parking lots. At Howard Terminal, it’s being used to park trucks while they wait for shipments at the Port of Oakland. At the Coliseum, it’s used to park cars for a bunch of sporting events that, because the Raiders and Warriors are moving, aren’t going to happen there any more.

So the question becomes, can the A’s acquire these land parcels at the value of a parking lot, and make them more valuable than a parking lot?

The government agencies who control these parcels have to try to figure out, how much is this land worth if they did nothing with it, or if they sold it to someone besides the A’s? The A’s have to figure out, how much could they make either parcel (or both parcels) worth if they built (or didn’t build) a ballpark on top of it? And somehow, those numbers have to work for both sides of the negotiations on the land.

This is where the arbitrage becomes a math problem. And we’re not the A’s, so we don’t have the numbers. We’re not doing the math. We don’t know if the numbers will work to meet the A’s growth minimums and targets or not. Best we can do from the outside is understand how the math would work on the arbitrage, if we did have the numbers.

And if the math works, it’s a more ethical way to finance a ballpark, because you’re not taking someone else’s money with no promise of returns or ownership in order to finance your own growth. You’re taking the inherent surplus value of a Major League Baseball team, and turning that, indirectly, into the money to build the ballpark.


Becoming a Tech Company

This is the Kaval Count element least likely to apply to a ballpark. But I want to bring it up, because it seems like the A’s under Kaval and COO Chris Giles have been trying to think like a tech company, even if the nature of their business doesn’t let them technically become one. Even if a ballpark can’t have the unique economics-busting properties of software, there are advantages to be gained by a tech-company approach.

I’m going to use Ben Thompson’s definition of a tech company from his blog, Stratechery:

Note the centrality of software in all of these characteristics:

  • Software creates ecosystems.
  • Software has zero marginal costs.
  • Software improves over time.
  • Software offers infinite leverage.
  • Software enables zero transaction costs.

The question of whether companies are tech companies, then, depends on how much of their business is governed by software’s unique characteristics, and how much is limited by real world factors.

Software is a compelling thing to invest in, because it can break the laws of supply and demand. Usually, when you sell a unit of something, whether a product or a service, there is a cost to producing and distributing each unit. But with software, the cost is practically the same whether you sell one unit or one billion units. Your growth rate is never limited by supply, only by demand.

A ballpark is a physical asset, not a digital one. So it’s supply is necessarily going to be finite. The fire marshal will only allow a certain number of people into your space. You’re going to have a finite number of seats. You’re going to be limited by geographical distances; it’s hard to sell access to a ballpark in Oakland to someone in Oregon or Nevada, let alone Australia or Japan. So a ballpark can’t have the potential infinite reach that software can have. (Although, you never know, maybe some future AR/VR software may change that…)

But just because you’re too physical to have infinite reach doesn’t mean you can’t increase your reach by significant amounts, or even orders of magnitude. So let’s go through Thompson’s points, one by one:

Creating an ecosystem

The most valuable software platforms enable other people to find and create value on top of the software. This creates network effects, where the more people who are on a platform, the more useful the platform gets, which entices more people to join, and so on. Cyberspace ecosystems can grow exponentially into a winner-take-all status in a way that normal economic activity historically hasn’t.

The most successful ballparks do often create an ecosystem of other businesses around them. Bars, restaurants, parking lots and so forth all thrive when placed in proximity to a ballpark. Their loyal customers can become the ballpark’s loyal customers, and vice versa. Urban ballparks can have desirable network effects. But because this ecosystem is limited by geography, it won’t grow exponentially like software can.

Zero marginal costs

Software breaks the laws of supply and demand by having essentially an infinite supply. The cost of making the first unit of software sold is fixed, but any additional units adds almost zero additional costs.

A seat in a ballpark can only be sold a finite number of times over the lifetime of that seat. In addition, for every X number of seats you sell, you need to hire Y number of ushers and ticket takers and so forth. And there’s also the minor detail that in every professional sport, roughly half of all revenues end up going to the players on the field.

But if you start to think like a tech company instead of a traditional sports team, you can come up with innovations that look more like a zero-marginal cost product than a seat at at ballgame. The A’s Access program, introduced by the A’s in 2019, is a subscription of access to the ballpark instead of seat tickets. A’s Access may not be a zero-marginal cost product, but it has a lower marginal cost than a seat does. It allows the finite geography of a ballpark to be filled more fluidly over the course of a game and a season. That fluidity can enable a team to build a smaller ballpark, because you don’t need to hold as much inventory on hand to accommodate the same number of customers.

Improves over time

Subscriptions are attractive to both software companies and software customers. Software companies like them because they create a more steady and predictable stream of income. Customers (especially business customers) like them because they allow them to use the software flexibly with their needs without having to make any big up-front commitments.

The thing that makes the software subscription engine run is the fact that software keeps improving over time. A new version comes out regularly, and if you’re subscribed, you’ll automatically get the new and improved version. If it didn’t improve, people would probably prefer to just buy the software up-front and hold on to it as long as possible.

Traditionally, it is hard to say that a ballpark improves over time. It is a large building, and once built, changing it significantly is usually very difficult and expensive. In addition, the ballpark is designed to host a baseball team. Baseball is a zero-sum game. It is impossible to keep improving a baseball team forever. It’s going to cycle between good years and worse years.

Still, if you were committed to it, you could probably design a ballpark to be much more modular than they’ve been historically. You could plan to have different sections of the park be replaced by something new far more often than they have in the past. This would allow for more experimentation with various products, and allow the ballpark over time to keep evolving into something more attractive to subscribers and more profitable for the business.

I don’t see any evidence that the A’s have planned any modularity with their Howard Terminal renderings, which look rather monolithic. I find that a bit surprising, since the A’s under Kaval and Giles have been quite willing to shoehorn various sections of the old Coliseum into modular experiments.

Software offers infinite leverage

Basically, this means you can take the software you’ve built and move into any market in the world immediately and sell it.

Obviously, that’s impossible with a ballpark. You’re bounded by geography. But that doesn’t mean you don’t want to expand those boundaries, so you can reach as large an audience as possible. This is where the exact location of the ballpark and the ease of getting there matters.

Zero transaction costs

Of the five criteria for a tech company, this is probably the one where baseball fits most closely. To achieve zero transaction costs, you want purchasing your product to be entirely self-service. With individual tickets, you still have ticket booths, but many tickets are now sold online. Traditional season tickets tend to still be handled with salespeople, but there’s no reason the A’s Access subscription can’t be entirely self-service, as well.


Become a Monopoly

Growing a business profitably is really hard when there’s a lot of competition. Competition makes you have to fight for the available demand, downward pressure on your prices, and hence, profits. The only way to avoid that is to become a monopoly, and have no competition.

A totally pure monopoly is not really a thing that exists very often in the wild. A coffee shop may be the only coffee shop in a certain neighborhood, but it’s still competing with the coffee shops in the next neighborhood over, plus with the coffee you can buy in a grocery store and make at home. But even a small monopoly of some sort lets you keeps prices higher than you otherwise would without the competition, so it helps your profit margins.

Most professional sports teams have monopolies in their local markets in their sports. If you want to see Major League baseball in Denver, the Rockies are your only choice. But the Rockies compete with the Nuggets and the Avs and the Broncos for sports dollars, and with TV and film and theater and music for entertainment revenues.

Up until now, the A’s have probably held one of the weakest monopolies of any professional sports franchise. They share the Bay Area baseball market with the Giants. And up through the 2019 season, they’ve shared the relatively small Oakland sports market with the Warriors and the Raiders.

But that’s about to change. With the Warriors and Raiders leaving, the A’s are going to be the only major sports team in the East Bay. Their “Rooted in Oakland” campaign is designed to promote that fact. The A’s have an opportunity here to grab hold of a monopoly in the East Bay on the one hand, and then start competing harder in the adjacent markets if they can.

This is where the design of the new ballpark really matters. If the A’s build a ballpark that looks like every other sports facility, then they’re competing with every other sports facility. But if they can build something unique, that provides an experience that nobody else in the region or the world, can provide, then they would be creating another kind of monopoly that no one else can compete with. That’s why the A’s looked outside the box to find an architect who could bring something different to the table.


Of course, there are other ways to generate wins besides the statistics in the Beane Count, and there are other ways to generate profitable growth besides the elements of the Kaval Count. You can win baseball games by hitting single and doubles, and by playing great defense and baserunning. You can also win the traditional business game by selling a higher volume of a better product made at a lower cost than the competition’s.

The point is we want to think about the ballpark in a Moneyball fashion. In building a new baseball team, we’re not just replacing one player with another. In building a new ballpark, we’re not just replacing a bunch of seats around a baseball field with some other seats around a baseball field. We’re assembling a bunch of subcomponents as cost effectively as possible. Can we assemble those subcomponents in a way that they add up to reach our targets?

So why would the A’s choose Howard Terminal with its political and physical hurdles over the Coliseum? Well, maybe the math of those subcomponents tell them so. Maybe the math says there’s a bigger opportunity for arbitrage at Howard Terminal than the Coliseum. Maybe the math says an ecosystem in Downtown Oakland will create bigger network effects than an ecosystem in East Oakland. Maybe the math says they can leverage the location of Howard Terminal into a wider market, particularly of those coming off work both in Downtown Oakland and Downtown San Francisco, than they can at the Coliseum location. Maybe the math says can hold a bigger monopoly with a unique waterfront ballpark with a rooftop park with views over the bay than they can with some sort of ordinary ballpark at the Coliseum site.

And maybe there are reasons beyond the math for making some of these decisions. Maybe the A’s have goals for this ballpark beyond just economic growth. Maybe they really do want to make a cultural impact on the East Bay community with this ballpark, and they think they can do that better at Howard Terminal, numbers or not.

We can’t know for sure, of course. We don’t have the numbers, the A’s aren’t sharing them, so we can’t do the calculations ourselves. But we can take the time, especially when it’s our jobs to do so, to try to understand the way the A’s would think things through.

Humans without Vulnerability
by Ken Arneson
2017-08-05 17:57

Every good story is, at its core, a story about human nature. Who are we? What are we really like?

In order to answer these questions about ourselves, we tell stories that put human beings to test. What happens if the various aspects of human nature get pitted against each other? What happens when we test our human nature against its limits? What happens if you change or remove some vital part of human nature?

Then once we have concluded a story about human nature, we then are left with a question. what does this story say about how we should behave and organize ourselves?

I recently found myself unintentionally but simultaneously binge-watching two stories that tested human nature in a very similar way, but drew completely different conclusions. Those stories were a web serial called 17776 by Jon Bois’, and the HBO television drama Westworld.

(WARNING: some mild spoilers follow.)

Both of these stories imagine a near-future where human beings find themselves in an environment where the intrinsic physical vulnerability of human nature has been removed. In the case of 17776, there are some mysterious nano-bots which automatically fix things anytime someone gets sick or hurt. In Westworld, humans interact with robots who they are free to treat however well or badly they like with no repercussions. People can kill the robots, but the robots can’t kill humans. If a robot is killed, they are removed, fixed, and returned to service good as new.

That’s pretty much where the similarity between these two stories end. The two stories reach very different conclusions about what humans would do if they suddenly became physically invulnerable. Bois imagines that people would spend their days playing and watching increasingly elaborate games of football. Westworld, on the other hand, thinks that people would primarily indulge themselves with sex and violence.

17776 is optimistic about human nature, and the conclusion you could draw from it is that our vulnerability essentially causes us to indulge in behaviors that harm other people. Human nature is essentially good, and if you removed the external sources of our vulnerabilities, there would be no point in bothering to harm anyone else, so we wouldn’t. Westworld, more pessimistically, implies that it is our vulnerability that prevents us from harming others, because we are afraid of reciprocal harm. If you remove that fear, we will all become psychopaths and indulge in orgies of harm. We are by nature essentially wild, dangerous animals that need to be restrained.

Which model of human nature is more correct? It’s hard to know for sure. These are fictional stories. In real life, you cannot simply devise a scientific experiment where you remove vulnerability from human nature and see what happens. Every aspect of human nature, our emotions and intellect capacity and built-in heuristics are evolutionary responses to all the various sorts of vulnerabilities that all our ancestors faced since the creation of the earth. Human nature consists of a complex jumble of behaviors that are not easy to reduce down with a simple two-dimensional A/B test.

But speaking of simple, two-dimensional A/B tests, I will leave it as an exercise for the reader to draw the parallel between these two views of human nature, and the views of human nature that underlie the policies of our two American political parties.

One Small Step Towards a Theory of Pitch Sequencing
by Ken Arneson
2017-07-29 17:55

Three years ago, I wrote an article called “10 Things I Believe About Baseball Without Evidence“, in which I hypothesized that it ought to be possible to develop some sort of theory of pitch sequencing. To me, pitch sequencing is the very heart of the sport, the chess match between batter and pitcher which makes the sport compelling. But for all our progress in sports analytics in recent years, a theory of pitch sequencing — what it is, how it works, which pitchers are good at it, which batters can be fooled by it — seems as distant as ever.

In this article, I hypothesized (without evidence, as the title suggests) that such a theory would involve somehow understanding that the brain of the batter makes predictions for the next pitch based on previous pitches:

I believe that before any given pitch, the batter is in some sort of Prediction State for the next pitch. After each pitch, the batter then moves into a different Prediction State.

One year after I wrote this evidence-free idea, a piece of evidence came in which supported my hypothesis.

Jeff Hawkins and Subutai Ahmad, who work for a company called Numenta which is trying to reverse engineer the brain with computers, published in October of 2015 a paper called “Why Neurons Have Thousands of Synapses, A Theory of Sequence Memory in Neocortex”.

You can read a nice layperson’s summary of the paper here. But I’ll summarize the summary even further.

Memory in the brain consists of cells called neurons. These neurons have different parts, and one of these parts is called “distal synapses”. Up until this point, nobody really had a good idea what these distal synapses were for, because they didn’t seem to do anything while a particular memory was firing. Hawkins and Ahmad theorize that this is because the distal synapses don’t cause the neuron to fire immediately. Instead, they electrically prepare the cell to fire quickly if a signal comes in from a certain direction. And it is this preparation which allows the brain to make predictions about sequences of events. Relevant quote from the paper:

“Each neuron learns to recognize hundreds of patterns that often precede
the cell becoming active. The recognition of any one of these
learned patterns acts as a prediction by depolarizing the cell
without directly causing an action potential. Finally, we show
how a network of neurons with this property will learn and
recall sequences of patterns. The network model relies on
depolarized neurons firing quickly and inhibiting other
nearby neurons, thus biasing the network’s activation
towards its predictions.”

And herein lies the physical foundation of a theory of pitch sequencing. For if Hawkins and Ahmad are correct about sequential learning, it means that there is indeed some sort of Prediction State that the brain is in before each pitch.

Once the brain has seen some sort of sequence of inputs, it prepares itself to recognize that sequence again, and to recognize and react to it more quickly the next time it appears, by being electrically primed to react through this neuronal depolarization.

At this point, it’s important to understand that we’re not just talking about sequences of individual pitches here (a curve followed by a fastball followed by a changeup). It can be that, too, but not only that.

A single pitch in and of itself is a sequence of patterns happening that the brain needs to recognize. It’s a windup, and then a release, and then a ball movement out of the hand, and then a spin which one can perhaps recognize, and then a speed and a directional movement of the ball in one way or another.

Each of these patterns and sub-patterns and sub-sub-patterns that compose a pitch are represented in the brain at the neuronal level. As a batter observes sequences of (sub-)(sub-)patterns, the brain automatically prepares itself to see those sequences again by depolarizing the neurons to make them respond faster to these patterns. Thus, from the pitches it has seen in the past, the brain moves into a sort of Prediction State about the pitches it anticipates seeing in the future.

This has the effect, as Hawkins and Ahmad put it, of “biasing the network’s activation towards its predictions”. The batter’s Prediction State has a bias, and pitchers can exploit this bias. The brain is ready to react to some patterns, which it will react quickly to, but at the expense of inhibiting a reaction to other other patterns, which it will be slower to react towards.

So if you throw three fastballs with the same speed and the same location in a row, the batter’s brain will become more and more prepared/biased to predict that pitch accurately with each subsequent pitch, and the batter becomes more likely to hit the ball hard.

But if pitchers understand what the batter’s brain is biased towards, they can fool the batter by defying that prediction. Throw a changeup to the same location, but with a different speed, and you can make the batter swing too early. The wrong neurons get fired, and the ones that should have fired to hit the ball properly are instead inhibited by the bias, and the batter does the wrong thing.

They say that pitching is an art, and perhaps at this time it is, but there is potential in this information that it could eventually be turned into a science.

* * *

This information doesn’t explain everything about how the brain processes sequencing, obviously. It’s just a initial framework for understanding how the brain learns to understand sequences of events and to predict them. And since we don’t really understand exactly it works in that general case in the brain, we therefore also don’t understand how it works for the specific case of pitch sequencing.

So if we have unanswered questions about the brain like, “how long does this cell depolarization last?” we also have corresponding unanswered questions about pitch sequencing, like, “how long does a batter remain biased towards a kind of pitch once he has seen it?”

The good news is, we can probably answer the second question without necessarily answering the first. There is data that will tell us how much better a batter gets when he sees the same pitch multiple times, either in a row, or in close proximity. Understanding the basic framework of how the brain works can help us ask better questions about pitch sequencing, and to develop useful theories about how it works, even before the neuroscientists figure out precisely how it works in the brain.

Good luck, baseball analysts.

The Data/Human Goal Gap
by Ken Arneson
2016-06-06 14:48

As I was writing a letter to my third-grade daughter’s principal in support of a change in homework policy (a letter which I’ve posted here), it occurred to me I was making a point about a phenomenon that isn’t unique to education at all, but happens in a lot of other fields, too: baseball, business, economics, and politics.

I don’t know if this phenomenon has a name. It probably does, because you’re very rarely the first person to think of an idea. If it does, I’m sure someone will soon enlighten me. The phenomenon goes like this:

* * *

Suppose you suck at something. Doesn’t matter what it is. You’re bad at this thing, and you know it. You don’t really understand why you’re so bad, but you know you could be so much better. One day, you get tired of sucking, and you decide it’s time to commit yourself to a program of systematic improvement, to try to be good at the thing you want to be good at.

So you decide to collect data on what you are doing, and then study that data to learn where exactly things are going so wrong. Then you’ll try some experiments to see what effect those experiments have on your results. Then you keep the good stuff, and throw out the bad stuff, and pretty soon you find yourself getting better and better at this thing you used to suck at.

So far so good, eh? But there’s a problem. You don’t really notice there’s a problem, because things are getting better and better. But the problem is there, and it has been there the whole time. The problem is this: the thing your data is measuring is not *exactly* the thing you’re trying to accomplish.

Why is this a problem? Let’s make a simplified graph of this issue, so I can explain.

Let’s call the place you started at, the point where you really sucked, “Point A”.
Let’s call the goal you’re trying to reach “Point G”.
And let’s call the best place the data can lead you to “Point D”.

Note that Point D is near Point G, but it’s not exactly the same point. Doesn’t matter why they’re not the same point. Perhaps some part of your goal is not a thing that can be measured easily with data. Maybe you have more than one goal at a time, or your goals change over time. Whatever, doesn’t matter why, it just matters they’re just not exactly the same point.

Now here’s what happens:

You start out very far from your goal. You likely don’t even know exactly what or where your goal is, precisely, but (a) you’ll know it when you see it, and (b) know it’s sorta in the Point D direction. So, off you go. You embark on your data-driven journey. As a simplified example, we’ll graph your journey like this:

statsgraph2

On this particular graph, your starting point, Point A, is 14.8 units away from your goal at Point G. Then you start following the path that the data leads you. You gather data, test, experiment, study the results, and repeat.

After a period of time, you reach Point B on the graph. You are now 10.8 units away from your goal. Wow, you think, this data-driven system is great! Look how much better you are than you were before!

So you keep going. You eventually reach Point C. You’re even closer now: only 6.0 units away from your goal!

And so you invest even more into your data-driven approach, because you’ve had nothing but success with it so far. You organize everything you do around this process. The process, and changes that you’ve made because of it, actually begin to become your new identity.

In time, you reach Point D. Amazing! You’re only 4.2 units away from your goal now! Everything is awesome! You believe in this process wholeheartedly now. The lessons you’ve learned permeate your entire worldview now. To deviate from the process would be insane, a betrayal of your values, a rejection of the very ideas you stand for. You can’t even imagine that the path you’ve chosen will not get any better than right here, now, at Point D.

Full speed ahead!

And then you reach Point E.

Eek!

Egads, you’re 6.00 units away from your goal now. You’ve followed the data like you always have, and suddenly, for no apparent reason, things have suddenly gotten worse.

And you go, what on Earth is going on? Why are you having problems now? You never had problems before.

And you’re human, and you’ve locked into this process and weaved it into your identity. You loved Points C & D so much that you can’t stand to see them discredited, so your Cognitive Dissonance kicks in, and you start looking for Excuses. You go looking for someone or something External to blame, so you can mentally wave off this little blip in the road. It’s not you, it’s them, those Evil people over there!

But it’s not a blip in the road. It’s the road itself. The road you chose doesn’t take you all the way to your destination. It gets close, but then it zooms on by.

But you won’t accept this, not now, not after the small sample size of just one little blip. So you continue on your same trajectory, until you reach Point F.

You stop, and look around, and realize you’re now 10.8 units away from your goal. What the F? Things are still getting worse, not better! You’re having more and more problems. You’re really, really F’ed up. What do you do now?

Can you let go of your Cognitive Dissonance, of your Excuse seeking, and step off the trajectory you’ve been on for so long?

F is a really F’ing dangerous point. Because you’re really F’ing confused now. Your belief system, your identity, is being called into question. You need to change direction, but how? How do you know where to aim next if you can’t trust your data to lead you in the right direction? You could head off in a completely wrong direction, and F things up even worse than they were before. And when that happens, it becomes easy for you to say, F this, and blow the whole process up. And then you’re right back to Point A Again. All your effort and all the lessons you learned will be for nothing.

WTF do you do now?

F’ing hell!

* * *

That’s the generic version of this phenomenon. Now let’s talk about some real-world examples. Of course, in the real world, things aren’t as simple as I projected above. The real world isn’t two-dimensional, and the data doesn’t lead you in a straight line. But the phenomenon does, I believe, exist in the wild. And it’s becoming more and more common as computers make data-driven processes easy for organizations and industries to implement and follow.

Education

As I said, homework policy is what got me thinking about this phenomenon. I have no doubt whatsoever that the schools my kids are going to now are better than the ones I went to 30-40 years ago. The kids learn more information at a faster rate than my generation ever did. And that improvement, I am confident, is in many ways a result of the data-driven processes that have arisen in the education system over the last few decades. Test scores are how school districts are judged by home buyers, they’re how administrators are judged by school boards, they’re how principals are judged by administrators, and they’re how teachers are judged by principals. The numbers allow education workers to be held accountable for their performance, and provide information about what is working and what needs fixing so that schools have a process that leads to continual improvement.

From my perspective, it’s fairly obvious that my kids’ generation is smarter than mine. But: I’m also pretty sure they’re more stressed out than we were. Way more stressed out, especially when they get to high school. I feel like by the time our kids get to high school, they have internalized a pressure-to-perform ethic that has built up over years. They hear stories about how you need such and such on your SATs and this many AP classes with these particular exam scores to get into the college of their dreams. And the pressure builds as some (otherwise excellent) teachers think nothing of giving hours and hours of homework every day.

Depression, anxiety, panic attacks, psychological breakdowns that require hospitalization: I’m sure those things existed when I went to school, too, but I never heard about it, and now they seem routine. When clusters of kids who should have everything going for them end up committing suicide, something has gone wrong. That’s your Point F moment: perhaps we’ve gone too far down this data-driven path.

Whatever we decide our goal of education is, I’m pretty sure that our Point G will not feature stressed-out kids who spend every waking hour studying. That’s not the exact spot we’re trying to get to. I’m not suggesting we throw out testing or stop giving homework. I am arguing that there exists a Point D, a sweet spot with just the right amount of testing, and just the right amount of homework, that challenges kids the right amount without stressing them out, and leaves the kids with the time they deserve to just be kids. Whatever gap between Point D and Point G that remains should be closed not with data, but with wisdom.

Baseball

The first and most popular story of an industry that transforms itself with data-driven processes is probably Michael Lewis’s Moneyball. It’s the story of how the revenue-challenged Oakland A’s baseball team used statistical analysis to compete with economic powerhouses like the New York Yankees.

I’ve been an A’s fan my whole life, and I covered them closely as an A’s blogger for several years. So I can appreciate the value that the A’s emphasis on statistical analysis has produced. But as an A’s fan, there’s also a certain frustration that comes with the A’s assumption that there is no difference between Point D and Point G. The A’s assume that the best way to win is to be excruciatingly logical in their decisions, and that if you win, everyone will be happy.

But many A’s fans, including myself, do not agree with that assumption. The Point F moment for us came when, during a stretch of three straight post-season appearances, the A’s traded their two most popular players, Yoenis Cespedes and Josh Donaldson, within a span of six months.

I wrote about my displeasure with these moves in an long essay called The Long, Long History of Why I Do Not Like the Josh Donaldson Trade. My argument was, in effect, that the purpose of baseball was not merely winning, it was the emotional connection that fans feel to a team in the process of trying to win.

When you have a data-driven process that takes emotion out of your decisions, but your Point G includes emotions in the goal of the process, it’s unavoidable that you will have a gap between your Point D and your Point G. The anger and betrayal that A’s fans like myself felt about these trades is the result of the process inevitably shooting beyond its Point D.

Business

If Moneyball is not the most influential business book of the last few decades, it’s only because of Clayton Christensen’s book, The Innovator’s Dilemma. The Innovator’s Dilemma tells the story of a process in which large, established businesses can often find themselves defeated by small, upstart businesses with “disruptive innovations.”

I suppose you can think of the phenomenon described in the Innovator’s Dilemma as a subset of, or perhaps a corollary to, the phenomenon I am trying to describe. The dilemma happens because the established company has some statistical method for measuring its success, usually profit ratios or return on investment or some such thing. It’s on a data-driven track that has served it well and delivered it the success it has. Then the upstart company comes along and sells a worse product with worse statistical results, and because of these bad numbers, the establish company ignores it. But the upstart company is on an statistical path of its own, and eventually improves to the point where it passes the established company by. The established company does not realize its Point D and Point G are separate points, and finds itself turning towards Point G too late.

Here, let’s graph the Innovator’s Dilemma on the same scale as our phenomenon above:

statsgraph3

The established company is the red line. They have reached Point D by the time the upstart, with the blue line, gets started. The established company thinks, they’re not a threat to us down at Point A. And even if they reach our current level at Point D, we will beyond Point F by then. They will never catch up.

This line of thinking is how Blockbuster lost to Netflix, how GM lost to Toyota, and how the newspaper industry lost its cash cow, classified ads, to Craigslist.

The mistake the establish company makes is assuming that Point G lies on/near the same path that they are currently on, that their current method of measuring success is the best path to victory in the competitive market. But it turns out that the smaller company is taking a shorter path with a more direct line to the real-life Point G, because their technology or business model has, by some twist, a different trajectory which takes it closer to Point G than the established one. By the time the larger company realizes its mistake, the smaller company has already gotten closer to Point G than the larger company, and the race is essentially over.

* * *

There are other ways in which businesses succumb to this phenomenon besides just the Innovator’s Dilemma. Those companies that hold closely to Milton Friedman’s idea that the sole purpose of a company is to maximize shareholder value are essentially saying that Point D is always the same as Point G.

But that creates political conflict with those who think that all stakeholders in a corporation (customers, employees, shareholders and the society and environment at large) need to have a role in the goals of a corporation. In that view, Point D is not the same as Point G. Maximizing profits for the shareholders will take you on a different trajectory from maximizing the outcomes for other stakeholders in various proportions. When a company forgets that, or ignores it, and shoots beyond its Point D, then there is going to inevitably be trouble. It creates distrust in the corporation in particular, and corporations in general. Take any corporate PR disaster you want as an example.

Economics

I’m a big fan of Star Trek, but one of the things I never understood about it was how they say that they don’t use money in the 23rd century. How do they measure the value of things if not by money? Our whole economic system is based on the idea that we measure economic success with money.

But if you think about it, accumulating money is not the goal of human activity. Money takes us to Point D, it’s not the path to Point G. What Star Trek is saying is that they somehow found a path to Point G without needing to pass through Point D first.

But that’s 200 years into a fictional future. Right now, in real life, we use money to measure human activity with. But money is not the goal. The goal is human welfare, human happiness, human flourishing, or some such thing. Economics can show us how to get close to the goal, but it can’t take us all the way there. There is a gap between the Point D we can reach with a money-based system of measurement, and our real-life Point G.

And as such, it will be inevitable that if we optimize our economic systems to optimize some monetary outcome, like GDP or inflation or tax revenues or some such thing, that eventually that optimization will shoot past the real-life target. In a sense, that’s kind of what we’re experiencing in our current economy. America’s GDP is fine, production is up, the inflation rate is low, unemployment is down, but there’s still a general unease about our economy. Some people point to economic inequality as the problem now, but measurements of economic inequality aren’t Point G, either, and if you optimized for that, you’d shoot past the real-life Point G, too, only in a different direction. Look at any historically Communist country (or Venezuela right now) to see how miserable missing in that direction can be.

The correct answer, as it seems to me in all of these examples, is to trust your data up to a certain point, your Point D, and then let wisdom be your guide the rest of the way.

Politics

Which brings us to politics. In 2016. Hoo boy.

Well, how did we get here?

I think there are essentially two data-driven processes that have landed us where we are today. Both of these processes have a gap between what we think of as the real-life goals of these entities, and the direction that the data leads them to. One is the process of news outlets chasing media ratings. And the other is political polling.

In the case of the media, the drive for ratings pushes journalism towards sensationalism and outrage and controversy and anger and conflict and drama. What we think journalism should actually do is inform and guide us towards wisdom. Everybody says they hate the media now, because everybody knows that the gap between Point D and Point G is growing larger and larger the further down the path of ratings the media goes. But it is difficult, particularly in a time where the technology and business models that the media operate under are changing rapidly, to change direction off that track.

And then there’s political polling. The process of winning elections has grown more and more data-driven over recent decades. A candidate has to say A, B, and C, but can’t say X, Y, or Z, in order to win. They have to casts votes for D, E, and F, but can’t vote for U, V or W. They have to make this many phone calls and attend that many fundraisers and kiss the butts of such and such donors in order to raise however many millions of dollars it takes to win. The process has created a generation of robopoliticians, none of whom have an original idea in their heads at all (or if they do, won’t say so for fear of What The Numbers Say.) You pretty much know what every politician will say on every issue if you know whether there’s a “D” or an “R” next to their name. Politicans on neither side of the aisle can formulate a coherent idea of what Point G looks like other beyond a checklist spit out of a statistical regression.

That leads us to the state of the union in 2016, where both politicians and the media have overshot their respective Point Ds.

And nobody feels like anyone gives a crap about the Point G of this whole process: to make the lives of the citizens that the media and the politicians represent as fruitful as possible. Both of these groups are zooming full speed ahead towards Point F instead of Point G.

And here are the American people, standing at Point E, going, whoa whoa whoa, where are you all going? And then the Republicans put up 13 robocandidates who want to lead everybody to the Republican version of Point F, plus Donald Trump. The Democrats put up Hillary Clinton, who can probably check all the data-driven boxes more skillfully than anybody else in the world, asking to lead everybody to the Democratic version of Point F, plus Bernie Sanders.

And Trump and Sanders surprise the experts, because they’re the only ones who are saying, let’s get off this path. Trump says, this is stupid, let’s head towards Point Fascism. Sanders says, we need a revolution, let’s head towards Point Socialism.

And most Americans like me just shake our heads, unhappy with our options, because Fascism and Socialism sound more like Point A than Point G to us. I don’t want to keep going, I don’t want to start over, and I don’t want to head in some old discredited direction that other countries have headed towards and failed. I just want to turn in the direction of wisdom.

“It’s not that hard. Tell him, Wash.


“It’s incredibly hard.”

The Long, Long History of Why I Do Not Like the Josh Donaldson Trade
by Ken Arneson
2014-12-01 22:22

Once upon a time, about a billion years ago, life was simple. Everybody lived in the oceans, and everybody had only one cell each. This was quite a fair and egalitarian way to live. Nobody really had significantly more resources than anyone else. Every individual just floated around, and took whatever it needed and could find, and just let the rest be.

This golden equilibrium was how life did business for a couple billion years. There was no such thing as jealousy or envy, and as a result, everyone lived pretty happy lives.

Then, one day about 800 million years ago, a pair of single-celled organisms merged to become the first multi-cellular organism in the history of the earth.

At first, these multi-celled creatures were just kind of like big blobs of single-celled organisms, and didn’t cause a lot of problems. Everybody was still kind of doing the same job as everyone else, even if they had organized themselves into a limited corporation of sorts. Most other single-celled creatures just figured they were harmless weirdos hanging out together, and ignored them.

They could not have been more wrong. For once the multi-cell genie was out of the bottle, Pandora’s box could not be closed, and the dominos began to fall. This simple change may have seemed innocent at first, but little did the single-cells know that they were the first creatures on earth to fall victim to the innovator’s dilemma. The single-celled creatures were far too invested in the status quo to change, and consequently ignored the multi-cellulars as irrelevant, and did not realize until it was too late that the game had suddenly shifted.

Continue…

The Short, Short Josh Donaldson Trade Story Based on Platoon Splits
by Ken Arneson
2014-12-01 11:22

Ok, look, I told y’all with the Cespedes trade that you can’t analyze an A’s trade of a position player without breaking it down by platoon splits across the whole lineup. But did any of y’all listen to me? No. Y’all are still trying to analyze Donaldson vs Lawrie as if they are single players on single teams instead of two players on two platoon teams with other players on the team. So stop that.

Now look, I’m gonna make this simple. I’m going to assume that both Lawrie and Donaldson will be equally healthy, and they’re roughly comparable defensive players. They may not be, but this is a quick and dirty exercise here, so bear with me. And I’m just going to use OPS, so I don’t have to make this story as long as the other Josh Donaldson story that’s coming later today.

Let us begin.

* * *

OPS 2014/career, Josh Donaldson vs. RHP: .727 / .744
OPS 2014/career, Josh Donaldson vs. LHP: 1.007 / .953

OPS, 2014/career Brett Lawrie vs RHP: .760 / .760
OPS, 2014/career Brett Lawrie vs LHP: .595 / .713

See, Brett Lawrie is actually better than Josh Donaldson against RHPs. The difference is that Donaldson crushes LHPs, and Lawrie for whatever reason actually is worse against LHPs than RHPs. He was particularly bad in 2014. I do not know why.

So for the platoon team that plays 2/3s of the A’s games, the one against RHPs, the A’s lineup actually just got better.

* * *

So now we need to fix the 1/3 of the A’s games against LHPs.

Last year, one of the A’s primary 1B/DHs against LHPs was Alberto Callaspo. He was awful. The A’s have signed Billy Butler to replace him.

OPS 2014/career, Alberto Callaspo vs LHP: .518 / .729
OPS 2014/career, Billy Butler vs LHP: .847 / .912

So the A’s are losing about .400 OPS points by downgrading from Donaldson to Lawrie vs LHPs, but they get back about .300 of those OPS points by upgrading from Callaspo to Butler.

So now all Billy Beane has to do find that extra .100 points of OPS against LHPs, and the math works. Maybe it will come just out of the fact that most players don’t have reverse splits last their whole careers, and Lawrie will actually bounce back and hit better against LHPs in the future. If so, QED.

* * *

Disclaimer: the above analysis does not mean I like this trade. I do not like this trade. That (much longer) explanation is here.

10 Things I Believe About Baseball Without Evidence
by Ken Arneson
2014-11-05 1:00

Well, here we are. The Giants won another World Series, while the A’s flopped in the playoffs yet again. I’m not one of those A’s fans who hate the Giants, but it’s starting to annoy the crap out of even me to see the Giants always succeed in the playoffs, while seeing the A’s always fail.

The A’s have had 14 chances in the last 14 years to win a game to advance to the next round of the playoffs. They have lost 13 of those 14 games. If the playoffs are truly a crapshoot, the odds of this happening are 1-in-1,170. (So it’s not technically always — they could have gone on to lose the 2006 ALDS against the Twins, too, which would have made them 0-for-16, with an unlikelihood odds of 1-in-65,536. So if you want to look on the bright side, things could be 56 times worse than they are.) And in a crapshoot, the odds of the Giants winning 10 playoff series in a row, as they have now done, is 1-in-1024.

So if you’re an A’s fan who hates the Giants, and who believes that the playoffs are a just crapshoot, you’ve been struck with a series of unfortunate events that had literally less than a 1-in-a-million chance of happening.

Sabermetrics has come up with no good explanation for it except to say, well, these things happen about once every thousand times, or once every million times, sorry A’s fans, it just happened to be your turn to hit that unfortunate lottery, and it’s just bad luck. Oh, and you have a crappy stadium that’s falling apart and a team ownership and a local government who all seem too incompetent to do anything about it unlike those guys across the bay, sorry about that, too, gosh you guys are unlucky, tsk tsk tsk.

Which is just a deeply, deeply unsatisfying answer. If you have an ounce of humanity, you will reject that explanation, and ask the obvious question.

But Why?

And to answer that question, the sabermetrician dives into the numbers, and pulls some out numbers with some number-pulling-out tools, and finds nothing to report. Nope, no evidence here of anything, so it must just be bad luck.

To which I ask: what if the reason the number-pulling-out tools can’t find any cause for the problem is because those number-pulling-out tools themselves are the problem?

I have no evidence of that. But it’s something I believe might be true, even though I can’t prove it.

* * *

I have a number of these beliefs–or hypotheses, if you will–about baseball, but I’ve mostly kept them to myself because of this lack of evidence. What the hell do I know, anyway? Who am I to pontificate? And why bother spouting these theories when I can’t defend them with evidence? So I just keep my mouth shut.

But I got a little bit of self-confidence in my belief system when Robert Arthur of Baseball Prospectus took one of my hypotheses (that injured A’s in the second half of 2014 had begun cheating on fastballs, making themselves vulnerable to offspeed pitches) and found evidence to support it ($):

The overall pattern of changes is beautifully consistent with Ken’s theory…

It’s very satisfying to find that the data supports one’s theory!

But I didn’t just come to this particular hypothesis that Mr. Arthur investigated out of thin air. This hypothesis arose out of a deeper foundation of hypotheses that color the way I look at baseball. I want to put all those hypotheses out on the table now, lack of evidence be damned. And maybe someone (maybe me someday, if I ever find the time and energy and resources and willpower to do so, which hasn’t happened yet) will take those hypotheses and invent the technology needed to find the evidence to support it.

So let’s put it out there.

* * *

Belief Without Evidence #1. A technological Sapir-Whorf hypothesis

The Sapir-Whorf hypothesis, a/k/a the Linguistic relativity principle holds that the language that a person speaks influences the way a person conceptualizes their world. The obvious example of this is that people have trouble distinguishing between colors if their language does not have a word for that color.

To a certain extent, I believe this hypothesis. Being fluent in both Swedish and English, I know there are certain concepts, such as the difference between belief in an opinion and belief in a fact, where the Swedish language makes clear distinctions (tycka and tro) and English does not. English speakers spend ridiculous amounts of time arguing about these things, and Swedes simply don’t need to. It’s not that English speakers can’t conceptualize the difference between opinion and fact, but doing so is way more difficult in English, because the word “belief” in English is quite fuzzy, whereas in Swedish, the language makes it simply impossible to confuse the two.

I touched upon this in my essay in the 2014 Baseball Prospectus annual, that I believe a similar concept applies to the technology we use. The reason statistical analysis began to influence the way we conceptualize baseball in the 1990s is not because human beings suddenly became smarter in the 1990s. There were statistically informed people who suggested such analysis almost a century earlier. It happened in the 1990s because the price of the technology needed to perform such analysis had finally became reasonable.

The predominant technology we use to perform such analysis is SQL, which is the primary language used to query relational databases. SQL and relational databases are technologies which are built upon set theory. A set is basically an unordered collection of objects.

And this is where I believe that a technological Sapir-Whorf hypothesis applies to baseball. Practically all of our analysis of baseball statistics treats its data an unordered collection of baseball events: pitches, plate appearances, games, series. Standard baseball analysis (the public kind anyway, who knows what is being done inside these organizations) treats its data that way because that’s the way SQL treats its data. The available technology guides our conceptualization of the world. And that leads us to my second hypothesis:

Belief Without Evidence #2. Baseball events are NOT unordered

For any batter to hit a ball, the batter needs to predict where the ball is going to be before it reaches the bat. There are two different mechanisms for this prediction.

First, there is a conscious prediction. The batter may decide, consciously, based on some sort of rational analysis, that he is looking for a fastball down and in, and wants to swing at only a pitch in that location that he can pull.

But once the pitcher releases the ball, this kind of conscious prediction mechanism is far, far too slow to be of any use. At this point, everything is turned over to a much faster, subconscious, automatic system to predict the actual flight of the ball, and to send the muscles in motion to meet the ball.

My thoughts here are heavily influenced by Jeff Hawkins‘ book On Intelligence, which lays out a framework for how this automatic system in the brain works as a memory-based prediction machine.

Order matters in baseball, because this automatic prediction mechanism has a strong recency bias. (A conscious prediction might not have a recency bias if truly rational, but how often does a batter perform a purely rational analysis at the plate?) The speed, location and movement of the most recent pitch will affect the brain’s automatic prediction of the speed, location and movement of the next pitch. The more recent a pitch, the more it affects the automatic system’s prediction for the next pitch.

Pitch sequencing, therefore, is at the heart of the very sport of baseball, yet it is woefully understudied in current public analysis, because our tools, based on a foundation of unordered sets, are woefully bad at processing and studying sequenced events.

There is a whole industry now dedicated to the statistical analysis of baseball using these set-based SQL tools. But SQL does not have a recency bias clause in its syntax that you can apply to a query. Because these tools don’t handle the ordered data well, they basically ignore The. Very. Core. of the sport: the sequencing battle between pitcher and batter.

Let me say that again: statistical analysis (that we in the public are aware of) takes the most important element of the sport, and ignores it.

It’s like having Newtonian physics without relativity and quantum mechanics. There’s a lot you can do with Newtonian physics, but at the extremes, it begins to break down, because it is ignoring some deeper, more fundamental truths.

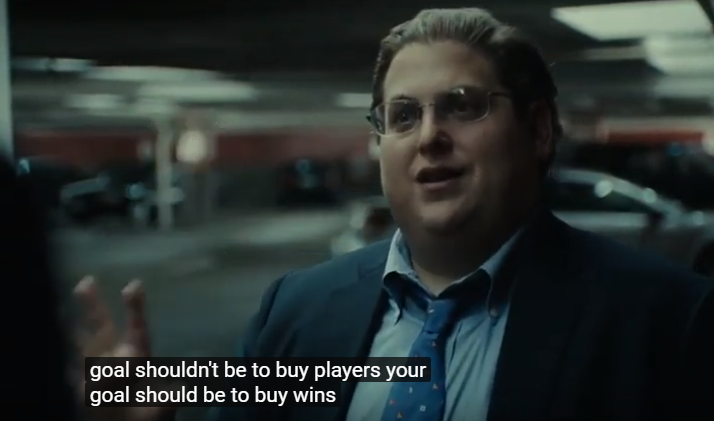
If you’re a team that relies on constructing its roster using such statistical analysis, what mistakes are you making by ignoring the most important part of the game?

Belief Without Evidence #3. All high-level sabermetric truths derive from lower-level truths about human biomechanics and psychology

And not vice versa. Things like platoon splits and home field advantage are not Constants of the Universe like the speed of light or the Planck-Einstein relation. The arise from more fundamental truths about human anatomy and psychology.

For instance, once I got in an argument in which I did not believe that Sean Doolittle pitched better to certain catchers than others. The stats did not agree with me, albeit perhaps with a small sample size. But my objection wasn’t to the numbers, adequate sample size or not, it was to the lack of any sort of underlying physical/psychological mechanism where this these numbers could derive from. Sean Doolittle throws 90% fastballs. What the hell difference physically/psychologically does it make what catcher is back there catching it? It’s the same pitch, no matter who is catching it.

I do not consider a sabermetric truth to really be a truth unless there is a biomechanical/psychological foundation upon which that truth can rest, and from which that truth is capable of being derived.

Belief Without Evidence #4. Pitches are paths between states in a Prediction State Automaton

First, a little explanation of automata:

Automata theory is used in computer science to study states. For example, you can look at baseball as an base/out automaton, where before each plate appearance, the base/out combination is in one “state”, and in another “state” after the plate appearance. There are rules that tell you what possible states you can be in before and after a plate appearance.

So, at the beginning of an inning, the baseball base/out automaton is in a {Nobody on, 0 out} state. After the first plate appearance, you will be in one of five possible states:

{Runner on 1st, 0 out}
{Runner on 2nd, 0 out}
{Runner on 3rd, 0 out}
{Nobody on, 0 out} (Batter homered)
{Nobody on, 1 out}

You can’t, after the first appearance, reach a state where there are two runners on or two outs. You have to go to an intermediate state first. There are exactly 24 possible states you can have in this automaton. Each state in this automaton is a two dimensional {base, out} object. And from any of these 24 possible states, there are a limited, finite number of possible following states.

The “automaton” then, defines the what possible states can exist, and the rules by which you can move from one state to another.

Got it?

OK, now to the thing I believe without evidence: I believe that before any given pitch, the batter is in some sort of Prediction State for the next pitch. After each pitch, the batter then moves into a different Prediction State.

I don’t have a clear belief on exactly how many dimensions these Prediction States have. Maybe the Prediction State has three dimensions it:

1. Whether to swing
2. When to swing
3. Where to swing

Or maybe these Prediction States are much more complex, combining the above three states with specific kinds of pitches and movements and locations. It may be expressed by something like this, for example:

{60% expection of fastball, 30% changeup, 10% curve;
80% outside, 10% middle, 10% inside;
60% down, 30% middle, 10% up;
70% in the strike zone, 30% out of the strike zone}

and then if the pitcher throws you a fastball on the lower outside corner for a strike, perhaps you move to a state like this:

{70% fastball, 20% changeup, 10% curve;
85% outside, 8% middle, 7% inside;
70% down, 20% middle, 10% up;
75% in the strike zone, 25% out of the strike zone}

Or whatever. I don’t really know as what the parameters for these Prediction States should be. Is it {pitch type, in/out, up/down, movement/straight, fast/slow} or some other combination of pitch attributes? I don’t know.

And to what extent are these prediction automata more or less universal, or does each batter have his own unique automaton with its own unique rules? Again, I don’t know.

But I do know that if I were to build a technology for analyzing baseball, this is where I would begin, right at the core of the game, the engine that drives the sport: what pitch the batter is expecting from the pitcher, and what happens when the pitch he gets conforms or deviates from that expectation.

In order to unite the quantum and Newtonian versions of baseball analysis, the biophysical and the statistical, any Grand Unified Theory Of Everything Baseball must, in my belief, have some way to handle the Prediction State of the batter.

Belief Without Evidence #5: The quality of a pitch is a function of its speed, location, and movement, and also of the batter’s swing and prediction state

There are a few pitchers, like Aroldis Chapman, who can throw a pitch with such high-quality speed that the location, movement, and prediction state are rather irrelevant. And there are some, like Mariano Rivera, who have such a combination of high-quality location and movement that the speed and prediction state don’t matter much. With pitchers like that, the batter can predict perfectly what pitch he’s going to get, and still not hit it.

But most pitchers do not possess such a high-quality pitch that they can be predictable and get away with it at the Major League level. They need to manipulate the prediction state of the batter in order to succeed.

The less a batter is expecting a certain pitch, the less likely he is to make good contact. But pitching is not just a function of being unpredictable: the pitcher must balance what the Prediction State of the batter is and the batter’s ability to hit it, with his ability to also throw a pitch with good speed, location, and movement.

The complex nature of that 5-dimensional object ( {speed, location, movement, swing, prediction state} ) is what makes baseball so fascinating from pitch to pitch.

So for each pitch, the pitcher wants to:

1. Choose a pitch the batter is likely to predict incorrectly
2. Choose a pitch the pitcher is likely to throw with good speed, location, and movement
3. Choose a pitch which will result in a suboptimal swing path, resulting either in a miss or weak contact
4. Choose a pitch which, if not put in play, worsens the batter’s Prediction State for the next pitch

Belief Without Evidence #6: The quality of an at-bat is a 3-dimensional function

Those three dimensions being:
1. Getting a good pitch to hit
2. Hitting a ball hard when you do
3. Hitting a ball hard if you don’t.

A good pitch to hit is a pitch that (a) he is successfully predicting, and (b) he can get a good swing on. Whether he can get a good swing on a particular pitch depends on what his swing path is.

And again, there are two kinds of predictions: the automatic subconscious one where the batter just reacts to a pitch, and a conscious one where the batter decides beforehand to look for a certain pitch and ignore all others. And the count plays a big role whether the batter can take an approach to consciously look for a particular pitch, or whether he should (with two strikes especially) just let his subconscious react to whatever comes in there.

On the subconscious level, the more the pitcher keeps throwing the same pitch, the more the batter predicts that pitch accurately, and the more likely the batter is to hit that pitch. When pitchers talk about “establishing the inside fastball” for example, this is what they mean: to change the Prediction State in such a way that an inside fastball becomes part of the Prediction State, and thereby necessarily reduces the expectation of a different pitch in the future.

Just because a batter gets a pitch he is predicting, does not mean he will hit it. Most batters have some kind of hole in their swing. Some batters prefer high pitches, others low. Some are vulnerable inside, and others can’t hit the outside pitch well. Some can hit a fastball, but can’t time an offspeed pitch. Others have a slow bat speed and struggle with fastballs, but feast on the slower pitches.

So for each pitch, the batter wants to:
1. Predict a pitch correctly
2. Swing at a pitch that if it lets him approximate his optimal swing path
3. Take a pitch if it would cause a suboptimal swing path (unless 2 strikes in zone)
4. Take pitches out of the zone to move to a better Prediction State for the next pitch
5. If in a 2-strike situation, make contact (foul or fair) on a pitch in the zone

Belief Without Evidence #7: SQL-reliant GMs don’t value the third dimension of #6 enough

In a vast sea of unordered pitches from an unordered group of pitchers, you will get a randomly-distributed plethora of good pitches to hit, so the numbers will all work out in the end. So you acquire hitters based on these vast seas of data, ignoring what the batter does with difficult pitches to hit, because in the long run, they don’t matter much.

But against a good pitcher on a good day who does not give you a good pitch to hit, what do those batters do? Do they hit a ball hard if they don’t get a good pitch to hit?

To me, the biggest difference between the A’s in the playoffs and the Giants in the playoffs is Pablo Sandoval. Because there may not be anyone in baseball right now better than Sandoval who does damage even when he does not get a good pitch to hit. He can turn pitches in the dirt, in his eyes, and/or six inches off the plate into a hit. He’s almost immune to prediction state manipulation by opposing pitchers. And Hunter Pence, though not as extreme as Sandoval, has similar characteristics.

The A’s simply do not pursue those types of players. Players like Sandoval tend to have low OBPs, because they swing at so many bad pitches. Minor leaguers with that profile flop far more than they succeed, so they’re a bad risk to take. But there are times, against a good pitcher on a good day who is simply not giving hitters a good pitch to hit, that it is valuable to have a player who often does damage even with a bad pitch to hit. And those times happen more often in the playoffs.

A technology that used a system of evaluating players in which high-level statistics of player value were derived from a low-level {speed, location, movement, swing path, prediction state} matrix would better identify the true value of such players.

Belief Without Evidence #8: Diversity is Good for Batting Lineups

This belief is related to the belief about the definition of the quality of a pitch, and to the belief of a biomechanical/psychological foundation to all of this. A lineup with too many batters with similar strengths and weaknesses can make it easier for a pitcher to settle into a psychological/mechanical rhythm and mow down such a lineup. A lineup that is diverse (some hit fastballs, some like it inside, or low, some slug, others make contact, etc.) makes a pitcher have to change his approach from at-bat to at-bat. That forces the pitcher to have to make a variety of quality pitches in order to win. It’s harder for a pitcher to win if he has to have multiple pitches working well.

So when I praised the Giants for having Pablo Sandoval, I did not mean that an entire team of hitters like Pablo Sandoval would be ideal. But having one or two guys like him in a lineup with some more patient-type hitters is a good thing.

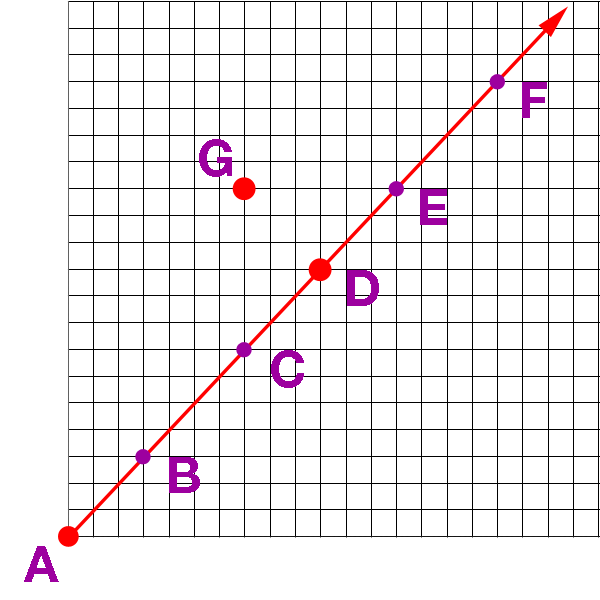
Belief Without Evidence #9: A lineup without holes scores runs exponentially, not linearly

This is probably the easiest of my hypotheses to disprove. But I have the gut feeling that one guy who is an automatic out in the middle of a lineup can take a rally that might score five runs and drop that rally down to 0 or 1 runs.

I think we saw this play out with the 2014 Oakland A’s. At the beginning of the year, everyone in the lineup was healthy and hitting somewhat near or above expectations. The A’s were just killing it in the pythagorean win column, because they’d get a rally going and that rally would just keep going and going.

But then Josh Donaldson and Brandon Moss started having some nagging injuries, and Moss in particular became pretty much an automatic out for a month or two. Those five-run rallies, once plentiful, almost instantly disappeared. Every rally seemed to be killed by a terrible at-bat in the middle of it.

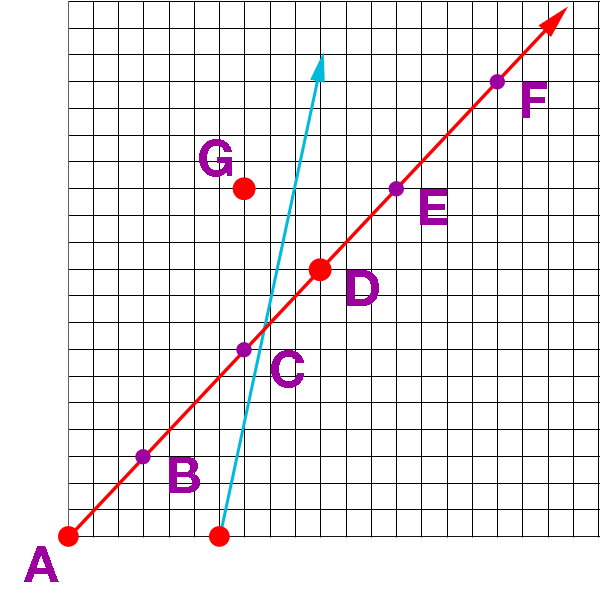
Almost every team has a hole in the lineup at any given time, someone who is slumping for whatever reason. So for most teams, run scoring appears to be linear. But in those rare cases when everyone is clicking at the same time, their run scoring graph turns like a hockey stick and shoots upward.

The A’s success early in the year depended on the lineup being holeless, and when holes appeared, the whole thing collapsed back from exponential scoring into linear.

Belief Without Evidence #10: A’s fans are magical elves

I’ve been playing in my mind lately with the idea that A’s fans are like the house elves in the Harry Potter stories.

We exist so that others may abuse us. The greatest triumphs of others often comes at our expense. We dress in ratty clothing (stadium). Yet despite this constant abuse, we are fiercely loyal to our master. We attack viciously anyone who dares attack our master. We perform magic (great stadium atmosphere) on their behalf, no matter how awful our masters treat us in return.

If ever we were given clothing (a new stadium) by our master, we would be free of our bondage. Some, like Dobby, desire this, but others would not know what to do with themselves with freedom and wealth. It would ruin the very essence of their being.

I used to be like Dobby, longing for the freedom that a World Series victory and/or a new stadium would bring. But now, I am beginning to feel that the other elves are right — that it is wrong to support S.P.E.W. and long for something that would destroy who we are.

We are meant to suffer, so that other wizards may have their glories. We are elves. Let us be that we are and seek not to alter us.

Hubris
by Ken Arneson
2014-09-18 7:02

I believe the evidence is clear enough to tell us this much: We were created not by a supernatural intelligence but by chance and necessity as one species out of millions in Earth’s biosphere. Hope and wish for otherwise as we will, there is no evidence of an external grace shining down upon us, no demonstrable destiny or purpose assigned us, no second life vouchsafed us for the end of the present one. We are, it seems, completely alone.

Edward O. Wilson

In Sophocles’ play Oedipus the King, the title character hears a rumor that he may not be what he thinks he is: the son of Polybus and Merope, the King and Queen of Corinth. Polybus and Merope deny the rumor, but Oedipus seeks external confirmation, and visits the Oracle at Delphi. The oracle ignores his question, and instead prophecies that he will kill his father and wed his mother.

Oedipus has no evidence he is not his parents’ son. He has no evidence to suggest he will eventually kill Polybus and marry Merope. But the latter is a much bigger problem than the former, so Oedipus ignores the first small problem and acts on the second, leaving Corinth forever, so as to avoid this horrible fate. He then proceeds to live his life as if he had solved his problem. And, of course, because this is a Greek tragedy, he hadn’t.

Rumors are not facts. Prophecies are not proven theorems. Yet it is not true that Oedipus had no evidence that he was not his parents’ son. He had the rumor. He had the prophecy. In a Bayesian sense, he should have considered the odds of his being adopted having increased from 0% before hearing the rumor and the prophecy, to what–1%? 10%? 25%?–afterwards.

The odds being less than 50%, however, the logical thing for Oedipus to do when faced with any given binary decision is to act as if the rumor was false. That’s the choice that gives him the best odds of succeeding, based on the information he has.


Hubris is extreme pride and arrogance shown by a character that ultimately brings about his downfall.

Hubris is a typical flaw in the personality of a character who enjoys a powerful position; as a result of which, he overestimates his capabilities to such an extent that he loses contact with reality. A character suffering from Hubris tries to cross normal human limits and violates moral codes.

–Definition of Hubris from Literary Devices

Is it extreme pride and arrogance to make the most logical decision? If so, then the human condition is tragic no matter what decisions we make.

If we choose with the odds based on the best information we have, we risk making a catastrophic decision because we lacked a critical piece of data. If we choose out of rumor and superstition and fear, we risk living a life where bad decisions compound themselves with every choice we make, and we end up living a suboptimal life.

The more successful we are, however, the more likely we are to make the catastrophic decision that results in a classical, Greek-style tragedy. With every successful decision we make, the less likely it is, in a Bayesian sense, that we are lacking that critical piece of information, and the more likely it is, in a Bayesian sense, that our decision-making process is sound.

If you have a decision-making algorithm, and you’re 50% sure it’s good, and then you test it, and it works, now you’re, what–51%? 55%? 60%?–sure that it works. Test it again and it works again, and the odds rise again. Eventually, if you reach the top of a hierarchy and stay there, you get really confident that you know what you’re doing. You’re the king!

Hubris, then, is the logical result of success. In every form of competition, somebody has to reach the top. The closer to the top you get, the more likely it is that you think your success is because of your knowledge and your decision-making process. The more you become certain that your data and your process are sound, the more you should logically make bigger and bigger bets based on that data and that process. And because of those bigger and bigger bets, the harder you will fall if and when it turns out that your data and/or your decision-making process was flawed.


But if you look at the impact those trades have on this particular team’s offense, it’s negligable. Offensively, the numbers tell us that losing Cespedes is no big deal.

Ken Arneson

If you look at Yoenis Cespedes statistically, there’s no real evidence that trading him would hurt the A’s very much. His numbers are mediocre, and easily replaced.

But looking back on the trade now, it feels like the A’s and their fans were focused on the wrong prophecy. The prophecy that a superstar ace pitcher was the missing piece to Moneyball. The significant rumor, the important piece of Bayesian evidence that we ignored was this: that the 2012-14 A’s team was not a product of Billy Beane’s genius. That this team played like complete and utter crap for five years, and then Yoenis Cespedes showed up, and it suddenly and immediately became good. That for 2 1/2 years, when Cespedes was in the lineup, the team played well, and when he was out of the lineup, the team played like crap, regardless of how well Cespedes was playing.

And then Beane, in his moment of hubris, trusting the logic and the data and the decision-making process that had made a best-selling book and a Hollywood movie of his life and had seemingly landed him in first place for 2 1/2 years, traded Cespedes away, and the team reverted immediately to playing like complete and utter crap again.

Could this Cespedes anomaly possibly, actually be real thing? No one can explain it. The fans don’t know why this Cespedes anomaly exists, and all the statisticians don’t know why, and Bob Melvin doesn’t know why, and Billy Beane doesn’t know why. There no evidence! It’s just rumor, innuendo, speculation, unfactual gobbledygook, completely illogical bullshit ex-post-facto rationalization.

But it’s there. It exists. It hurts to look at it. And it has all of us A’s fans wanting to poke our eyes out.

The gods hate us. They want to punish us for our pride and arrogance.

And you may say, gods are superstitious nonsense, that there is no evidence of an external wrath raining down upon us, no demonstrable cruel destiny or fate assigned us, no eternal Sisyphean existence vouchsafed us for the end of the present one.

And that’s true. There is no evidence for the existence of God, or gods. Except for the small, annoying, persistent rumor that at this particular point in time, we are here.

The Yoenis Cespedes Trade
by Ken Arneson
2014-08-01 12:53

The Oakland A’s made a huge trade yesterday, sending their biggest name, Yoenis Cespedes, and a draft pick to the Boston Red Sox for Jon Lester and Jonny Gomes. They also made a smaller trade, sending Tommy Milone to the Minnesota Twins in exchange for Sam Fuld. Of course, the sports world was abuzz from the Cespedes trade, which stunned many.

A couple of things left me unsatisfied about the reactions I’ve seen of the Cespedes trade. One is an old idea, expressed in Moneyball back in 2002: you don’t try to replace Giambi/Cespedes with one player, you replace him with other players in aggregate across the roster. The other a newer idea: is that the A’s platoon so much, that you can’t just analyze A’s players as atomic units. You can’t just say X is a 5 WAR player and Y is a 2 WAR player, and X – Y = 3 WAR. You have to break them down into their platoon split components, because the A’s use platoons far more efficiently than is baked into most of these formulas.

For example, if you look at Jonny Gomes as an atomic unit, he has suffered a severe decline this year. He’s hitting .234/.329/.354 this year, a far cry from the .262/.377/.491 he hit with the A’s in 2012, and in no way close to being able to replace Cespedes’ production. However, if you break Gomes down into platoon splits, you can see that his decline is entirely against right-handed pitching, where he is hitting a godawful .151/.236/.258 this year. Against left-handed pitching, however, he is still hitting a very healthy .302/.400/.431. A’s manager Bob Melvin is a master at getting the platoon advantage for his players, so we can bet we won’t see much of Jonny Gomes against RHPs.

So what I want to see is an analysis that really looks at the A’s as two teams: one team against RHPs which plays 72% of the time, and another team against LHPs which plays 28% of the time. Let’s look at those teams before and after the trade, and see how much the trades affected those two teams, even if we calculate these things in a kind of quick and dirty fashion.

To do that, you need to project performance by splits, which isn’t easy to find. PECOTA has a Marcel-like calculation called “Platoon multi”. Dan Szymborski pointed me to a platoon projection spreadsheet he created for his ZiPS projection. So I took that pre-season projected data, and combined it with their 2014 performance in a spreadsheet, to create a rest-of-season projection. (Okay, that wasn’t so quick, so the rest of this will be kind of dirty. We don’t have to be precise here, we just want a ballpark understanding of what’s going on.)

There’s another complicating factor here, in that the A’s currently have three players who are injured: Coco Crisp, Craig Gentry, and Kyle Blanks. Plus, Stephen Vogt has an injury that prevents him from catching, but not playing 1B or OF. So we’re going to run one set of numbers assuming everyone is healthy, and another assuming these injuries. Here are the best-hitting lineups (not by batting order, but sorted by GPA, from best player to worst). We’ll make removed (traded or optioned) players red, and added players blue.


Healthy lineup vs LHP: (position,obp,slg)

Donaldson (3b, .373, .604)
Norris (c, .399, .519)
Gomes (dh, .380, .440)
Cespedes (lf, .332, .473)
Crisp (cf, .353, .411)
Moss (rf/dh, .326, .439)
Blanks (1b, .336, .407)
Gentry (lf/rf, .348, .361)
Lowrie (ss, .320, .395)
Callaspo (2b, .304, .324)

Bench: Fuld, Vogt, Burns, Reddick, Punto, Jaso, Sogard.

Estimated runs per game, new lineup: 5.266
Estimated runs per game, old lineup: 5.218

The offense improves vs LHPs, because Gomes is actually slightly more productive than Cespedes, thanks to his high OBP. The defensive effect is that Moss gets moved from DH into the outfield, because he’s a better fielder than Jonny Gomes, but not a better fielder than Cespedes.


Healthy lineup vs RHP:

Jaso (dh, .372, .452)
Moss (lf/1b, .333, .510)
Reddick (rf, .325, .458)
Vogt (1b/c, .328, .422)
Cespedes (lf, .302, .453)
Crisp (cf, .321, .417)
Lowrie (ss, .329, .395)
Donaldson (3b, .321, .404)
Callaspo (2b, .333, .351)
Norris (c, .331, .353)

Bench: Blanks, Gentry, Fuld, Sogard, Punto, Gomes, Burns.

Estimated runs per game, new lineup: 4.810
Estimated runs per game, old lineup: 4.841

Losing Cespedes against RHPs has a more noticeable effect. Gomes and Cespedes are equivalent players vs LHPs, but the gap between Cespedes and his replacement against RHPs, Derek Norris, is larger, and creates a slight loss of runs per game. It also shifts Vogt and Moss around defensively to get Norris into the lineup.


Injured lineup vs LHP: (position,obp,slg)

Donaldson (3b, .373, .604)
Norris (c, .399, .519)
Gomes (dh, .380, .440)
Cespedes (lf, .332, .473)
Moss (lf/dh, .326, .439)
Fuld (cf, .337, .378)
Lowrie (ss, .320, .395)
Vogt (1b, .275, .448)
Callaspo (2b, .304, .324)
Burns (cf, .318, .292)
Reddick (rf, .245, .411)

Bench: Punto, Jaso, Sogard.
Out: Crisp, Blanks, Gentry.

Estimated runs per game, new lineup: 5.023
Estimated runs per game, old lineup: 4.852

Yeesh, those are some atrocious OBPs at the bottom of the lineup with these injuries, because LH batters Vogt and Reddick are forced into the lineup against LHPs. Fuld is also a LH batter, but he has a weird reverse platoon split in his career; he’s actually been better vs LHPs than RHPs. Like with the healthy group, going from Cespedes to Gomes is a slight upgrade against LHPs; but the upgrade from Burns to Fuld is enormous.


Injured lineup vs RHP:

Jaso (dh, .372, .452)
Moss (lf/rf, .333, .510)
Reddick (rf/cf, .325, .458)
Vogt (1b, .328, .422)
Cespedes (lf, .302, .453)
Lowrie (ss, .329, .395)
Donaldson (3b, .321, .404)
Callaspo (2b, .333, .351)
Norris (c, .331, .353)
Fuld (cf, .311, .321)

Bench: Sogard, Punto, Gomes, Burns.
Out: Crisp, Blanks, Gentry.

Estimated runs per game, new lineup: 4.685
Estimated runs per game, old lineup: 4.708

The main effect here is that Fuld gets Cespedes’ at bats, and that Reddick can move back to right field. But without the Fuld trade to complement the Cespedes trade, Sogard would be getting Cespedes’ at bats, and you’d have an awful outfield of Moss-Reddick-Vogt with Callaspo at 1b. Yeesh. You’re going to lose some offense, but that defensive alignment would probably kill you. I suspect that avoiding that defensive alignment alone is probably justification for trading Milone.


So let’s take those estimated runs per game, and extrapolate them over 162 games, and assume the average split of 72% RHPs and 28% LHPs, and combine those two split-handed teams into one team again, leaving us with just a healthy team and an injured team.

Of course, the injured team is not as good as the healthy team, and will be scoring fewer runs than the healthy team. But to analyze the trades, we don’t need to know the raw totals, we really only need to know how much the trades change the run scoring.

The healthy team loses 3.6 runs vs RHPs in the trades, but gains 2.2 runs vs LHPs, for a total loss of 1.4 runs over a whole season. It’s practically no loss of offense at all.

The injured team loses 2.7 runs vs RHPs in the trades, but gains 7.8 runs vs LHPs, for a total gain of 5.1 runs over a whole season. Most of that gain is from playing Fuld over Burns (vs RHPs) and Reddick/Vogt (vs LHPs).

Let’s say these three injured players are going to miss one-third of the remaining games to play. Multiply that 5.1 by one-third, and the -1.4 by two-thirds, and what you end up with is actually a slight gain (0.25 runs over the rest of the season), albeit so small that it is practically a wash.


The trades felt like a shock to many of us. On the surface, losing Cespedes’s sexy bat hurts, and trading a decent starting pitcher like Tommy Milone for a fourth outfielder seems like a waste. In a vacuum, that is true. But if you look at the impact those trades have on this particular team’s offense, it’s negligable.

Offensively, the numbers tell us that losing Cespedes is no big deal. And if everyone is healthy, trading for Fuld is a waste, because he wouldn’t play. But not everyone is healthy, especially in CF, and so Fuld is essential to keeping the offense at the level it would be without the trades.

So basically, we can consider the offense a wash. Now we can move on to analyzing the effect these trades have on the A’s defense and pitching. But I’m leaving that as an exercise for the reader. I’ve done enough for today.

Eric Sogard and the Innovation Fairy
by Ken Arneson
2014-03-10 11:30

seesogard2

See Eric Sogard.
Eric Sogard is a nerd.
This is his story.

Eric Sogard has a secret, special power.
Eric Sogard has #NERDPOWER.

What is #NERDPOWER?
How does it work?

Continue…

Fixing the Oakland Coliseum Fences (and Foul Territory)
by Ken Arneson
2014-01-31 13:31

Grant Brisbee has a fun series over on SB Nation where he ranks MLB stadiums by how well they make home runs look impressive. Surprisingly, he ranks the Oakland Coliseum 13th. It gets that high ranking because the various levels of Mount Davis provide a good contrast between a mediocre home run, and a towering one. When someone crushes one at the Coliseum, you can tell it’s crushed because it lands in the 2nd deck (down the line) or hits off the luxury boxes in center field.

That’s fine and all. I suppose it’s good that Mount Davis has some redeeming feature. But there are far more mediocre home runs than monster ones, and it’s what the current version of the Coliseum does to those wimpy home runs that I hate.

Hate hate HATE.

Really, there is nothing I hate more about the Coliseum than the placement of the outfield walls. Nothing. Not the troughs, not the sewage, not the crap we A’s fans have to take from other fans teams about the troughs and the sewage, not the 8th-inning Call Me Maybe, not even Mount Davis itself. I hate the placement of the outfield walls more than all of those things.

Except at the foul poles, there is no logic to the outfield walls at all. None. Look at the fence at any point between the foul poles. Why is the fence there? Why is it that height? No reason at all, really.

And worse than that, what really drives me bonkers about it is this: any EVERY point from pole to pole, if you hit the ball just barely over the fence, it DOES NOT LAND IN A SEAT.

Home runs should land in seats. Or if not IN seats, then OVER seats. Period.

* * *

Ok, Ken, you’ve been made Dictator of the Oakland Athletics for a day, and you can change one thing and one thing only. Give us your plan.

OK, I’m going to assume the A’s will sign a rumored 5-10 year lease extension, and are therefore planning to stay at the Coliseum awhile. This may be putting lipstick on a pig, but nonetheless, let’s make it a better place to watch a ballgame.

First of all, do you know why there is so much foul territory in Oakland? The story goes, as former A’s broadcaster Monte Moore use to tell, that the third deck had obstructed views of home plate because of its slope, so they had to move home plate further out than they planned.

I don’t know if that’s true or not, but let’s say that it is. Well, guess what? We’re not using the 3rd deck anymore. It’s (mostly) tarped off. So why is home plate still pushed out so far?

We’re going to put home plate back and the foul poles back to where they originally were supposed to be. Then we’re going to use the extra eight feet or so we gain to add some seats in front of the current bleacher seats. What we end up with is (a) an outfield configuration where, except for at the stairs, every home run lands in or over a seat, and (b) every seat in the main seating bowl is suddenly about two rows closer to the action, in a way that (c) shouldn’t cost ridiculous amounts of money to implement.

Here’s what it looks like with the new configuration in left field, and the old configuration in right field (click image for larger version):

coliseumremodelcompare900

Let’s look at this in more detail:


1. We’re moving the foul poles over about 6-7 feet, so that there’s only about 1 foot between the pole and the foul line seats. This pushes home plate back about eight feet or so, thusly:

coliseumhomeplate


2. The wall nearest to the foul poles is about 2-3 feet shorter than the seats, and begins to angle away from those seats as you move more towards center field. We’re fixing this. The walls go all the way up to the seats, and hug the seating section all the way. No more balls that land over this fence, but fall short of the seats. Compare the new and old corners:

coliseumcorners


3. We’ll get rid of that stupid idiotic ledge above the out-of-town scoreboard. With home plate being pushed about 8 feet back, we have room to add two or three extra rows of seats, and still keep roughly the same distance from home plate as before.

I don’t know if we keep a scoreboard there or not. If you give free wifi throughout the stadium instead, you probably don’t need it.

I cut and pasted Fenway’s Green Monster seats here, to show you don’t need to add seats identical to the other bleacher seats. There’s room for some creativity in this new section.

coliseumbleachers


4. Centerfield is now about 405 feet from home instead of 400, but we’ve cut down on the foul territory quite a bit, so this may keep the amount of offense roughly the same as before.

coliseumcenterfield

* * *

Ahhhhhhhh, now see? That’s much better.

I’m sure you have all loved your Dictator for the Day, and Wish Long Life for your Beloved Comrade Who Brings Glory to the Homeland. Now please excuse me, I have some propaganda posters to go photoshop.

Projected 2014 Oakland Athletics Anagram Roster
by Ken Arneson
2013-12-18 12:23

There’s no way to be gentle about this: A’s General Manager Baby Nellie’s offseason moves have clearly weakened the A’s anagram roster for 2014. They have become slightly worse across the board, but some of his moves in the bullpen…well, I just don’t know what he was thinking.

Starting Rotation:

The A’s have lost the two best anagrams from their 2013 starting rotation: Bartender Snot and No Local Robot. Angry Nosy and Rat Mocks Zit are decent replacements to be sure, but are also both clearly a step down. Fin Jar GIF looks like odd man out, as acronyms are purely replacement-level stuff, even if they can be pronounced.

11: Pro Radar Jerk
54: Angry Nosy
57: I Melt My Moon
64: Fin Jar GIF
67: Daily Rants
??: Rat Mocks Zit

Bullpen:

Ask the Pen: is there any better anagram for a reliever? No, there is not. And yet, the A’s just let him go for nothing. To ask the pen without him to match what they were with him is unfair.

It gets worse before it gets better. Swapping closer No Fat Burglar with Oh MJ Is On NJ is nothing but a disaster.

Trading away JV Errs Byline is addition by subtraction, but similarly wretched She Aces JV EZ is somehow still around.

On the bright side, there remains a solid young core led by Oldest Toenail. Greek Loungers may be the best A’s acquisition this offseason, and don’t overlook Banana Fodder.

With no options remaining, there may be no room for Fedora Groupie, so perhaps Baby Nellie can find a match for him with the Astros.

48: Okay Corn
60: She Aces JV EZ
61: Neat Odor
62: Oldest Toenail
65: Fedora Groupie
??: Oh MJ Is On NJ
??: Greek Loungers
??: Banana Fodder

Catchers

The roster of catchers remains the same. Order Sinker is the best gamecaller of the group, of course. Pegs Hot Vent remains to fill in should either of the other two catchers need to go on midseason pilgrimages again.

5: Hajj Soon
21: Pegs Hot Vent
36: Order Sinker

Infielders:

Armload Seas gnip-gnopped his way to Texas last summer, so the A’s have replaced him with Tonic Punk. It’s a slight upgrade, to a mostly intact infield where even the weakest link redeems himself with a Star Wars reference.

7: Mean Fainter
8: Roid Jewel
10: Rat Brain Doc
18: Palatable Colors
20: DJ Han Solo Nods
28: Scarier Dog
37: Random Snobs
??: Tonic Punk

Outfielders:

Grouchy Sin is out, Great Crying is in. You reap what you sow, I guess. Don’t forget that Random Snobs can play outfield if needed, which may leave no room to Erotically Ham.

4: Cisco Crop
16: Jocks Did Her
23: Erotically Ham
52: Eyes Second Pies
??: Great Crying

My Letter from 1989 about the Earthquake World Series
by Ken Arneson
2013-10-25 12:04

Grantland posted an oral history of the 1989 World Series and earthquake the other day. That prompted me to dig up an old letter I sent to my friends and family outside the Bay Area, mostly in Sweden, about my experiences during that time.

A bit of background: in October of 1989, I had just returned from a year living in Sweden with my girlfriend (now wife) Pam. Pam was staying at her parents’ house and I was staying with her brother, until we could find jobs and afford to get our own place.

In hindsight, this letter is quite long, full of unnecessary details and subplots, not unlike a Victorian novel. It also lacks a good plot, because, well, no buildings fell down around me or anything. Nobody in the story was hurt, nobody was rescued. But in my defense, this was back in the days when you couldn’t just send an email or post something on Twitter or Facebook or Instagram and have everyone you know around the world instantly know what’s going on in your life. My Swedish friends probably got some horrific pictures on TV of collapsed buildings and fires and thought San Francisco had fallen into the sea. We weren’t so overwhelmed with data that a lack of filtering was a problem. TL;DR was not a thing back then.

So, here it is, what I wrote back in 1989:

Continue…

How to Remove the Yahoo Sports background image on Chrome
by Ken Arneson
2013-08-29 20:33

Yahoo Sports remodeled their site this morning, and it’s awful. Mostly, I think, because the new background image on is really distracting and annoying. So I decided to zap it. Here’s how I did it, and you can too:

1. Install the Stylebot Chrome extension.

2. Once you install it, you will get a little “CSS” button on your toolbar.

3. Go to a Yahoo Sports web page.

4. Click the Stylebot “CSS” button on your toolbar.

5. Click “Install Style from Social…”

6. It should show “Loading…” for a second, then bring up “Remove background image from Yahoo Sports by kenarneson”.

You should now see a plain gray background instead of the grass field background.

* * *

I wanted to make it a plain white background like it used to be, but the text on the Yahoo Sports site is now mostly white, so that wouldn’t work. So I made it gray.

<< newer       older >>
This is Ken Arneson's blog about baseball, brains, art, science, technology, philosophy, poetry, politics and whatever else Ken Arneson feels like writing about
Google Search
Web
Toaster
Ken Arneson
Archives
2021
01   

2020
10   09   08   07   06   05   
04   

2019
11   

2017
08   07   

2016
06   01   

2015
12   11   03   02   

2014
12   11   10   09   08   04   
03   01   

2013
12   10   08   07   06   05   
04   01   

2012
12   11   10   09   04   

2011
12   11   10   09   08   07   
04   02   01   

2010
10   09   06   01   

2009
12   02   01   

2008
12   11   10   09   08   07   
06   05   04   03   02   01   

2007
12   11   10   09   08   07   
06   05   04   03   02   01   

2006
12   11   10   09   08   07   
06   05   04   03   02   01   

2005
12   11   10   09   08   07   
06   05   04   03   02   01   

2004
12   11   10   09   08   07   
06   05   04   03   02   01   

2003
12   11   10   09   08   07   
06   05   04   03   02   01   

2002
12   10   09   08   07   05   
04   03   02   01   

1995
05   04   02